|

USD/JPY holds above 139.00, heads for weekly loss

  • Japanese yen weakens amid higher government bond yields.
  • US Dollar Index rises 0.55% on a quiet low-volume session.
  • USD/JPY heads for weekly loss despite Friday’s gains.

The rally of USD/JPY was capped by the 139.50/60 area. Near the end of the week, the pair holds firm above 139.00 supported by rising sovereign bond yields as Wall Street posts gains.

Yen down as yields move up

The Japanese yen fell across the board on Friday, weakened by rising bond yields. The US 10-year bond yield rose to 3.75%, a two-day high while the German 10-year climbed to 1.98%. In Wall Street, the Dow Jones was up by 0.46% and the Nasdaq was falling by 0.29% on a shortened session.

The US Dollar Index was up 0.55% on Friday, but still headed toward the lowest weekly close since mid-August affected by the less hawkish FOMC minutes. Next week, attention will be on the Non-farm payrolls report due on Friday.

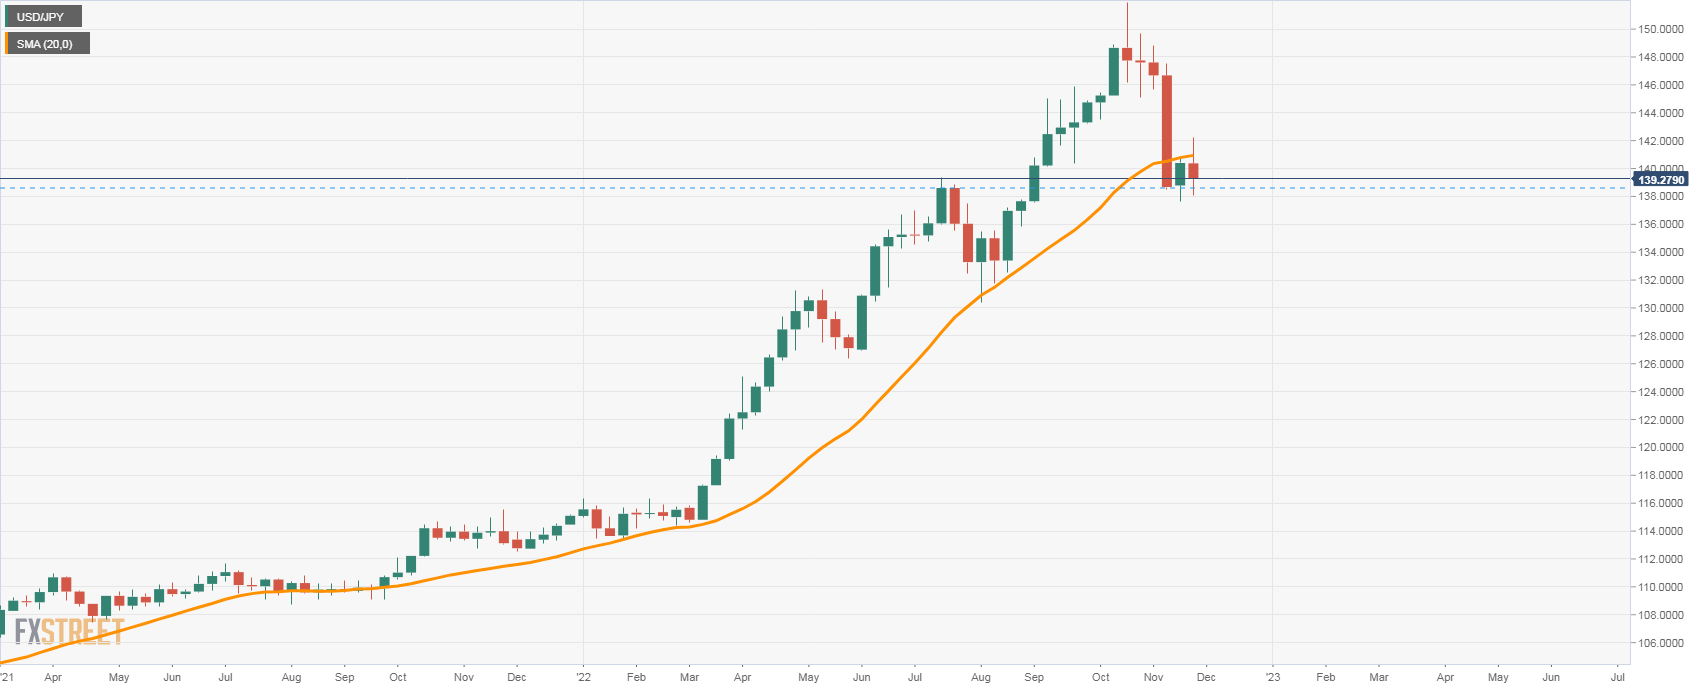
Firm below the weekly 20-SMA

The USD/JPY is about to post a weekly loss of a little more than one hundred pips. During the week it traded as high as 142.24, but then pulled back under the 20-week Simple Moving Average (SMA) that stands at 140.90.

The pair continues to move around 140.00, away from the multi-decade high it hit on October. The declines so far have been contained above 137.50. A daily close below 138.50 would increase the bearish pressure.

USD/JPY weekly chart

USDJPY

Technical levels

USD/JPY

Overview
Today last price139.34
Today Daily Change0.82
Today Daily Change %0.59
Today daily open138.52
 
Trends
Daily SMA20143.29
Daily SMA50144.84
Daily SMA100141.14
Daily SMA200133.84
 
Levels
Previous Daily High139.65
Previous Daily Low138.05
Previous Weekly High140.8
Previous Weekly Low137.67
Previous Monthly High151.94
Previous Monthly Low143.53
Daily Fibonacci 38.2%138.66
Daily Fibonacci 61.8%139.04
Daily Pivot Point S1137.83
Daily Pivot Point S2137.13
Daily Pivot Point S3136.22
Daily Pivot Point R1139.43
Daily Pivot Point R2140.35
Daily Pivot Point R3141.04

Author

Matías Salord

Matías started in financial markets in 2008, after graduating in Economics. He was trained in chart analysis and then became an educator. He also studied Journalism. He started writing analyses for specialized websites before joining FXStreet.

More from Matías Salord
Share:

Editor's Picks

EUR/USD holds above 1.1750 after mixed EU PMI data

EUR/USD manages to hold above 1.1750 but struggles to gather recovery momentum on Friday, following the mixed February PMI figures from Germany and the Eurozone. In the second half of the day, Q4 GDP, December inflation and February PMI data from the US will be watched closely by market participants.

GBP/USD recovers further toward 1.3500 after UK PMI data

GBP/USD is recovering ground further toward 1.3500 in European trading on Friday, helped by a modest uptick in the Pound Sterling after stronger-than-expected UK January Retail Sales and February PMI data. However, the pair's further upside could be limited amid persistent US Dollar strength as the focus turns to key US data. 

Gold sticks to positive bias above $5,000 ahead of US data

Gold gains some positive traction for the third consecutive day on Friday. holding above $5,000. Traders now look forward to the key US macro releases – the Advance Q4 GDP report and the Personal Consumption Expenditures (PCE) Price Index – for fresh trading impetus. 

US GDP growth expected to slow down significantly in Q4 after stellar Q3 

The United States Bureau of Economic Analysis will publish the first preliminary estimate of the fourth-quarter Gross Domestic Product at 13:30 GMT. Analysts forecast the US economy to have expanded at a 3% annualized rate, slowing down from the 4.4% growth posted in the previous quarter.

Iran tensions and AI fears at the forefront ahead of key US data

Thursday’s scorecard shows major US Stock benchmarks closed modestly in the red amid mounting US-Iran tensions and AI disruption worries. The S&P 500 shed 19 points (0.3%) to 6,861, the Nasdaq 100 lost 101 points (0.4%) to 24,797, and the Dow Jones Industrial Average dropped 267 points (0.5%) to 49,395.

Official Trump price approaches breakout with mixed signals from traders

Official Trump (TRUMP) is trading at $3.50 at the time of writing, approaching its upper consolidation range. A breakout from this range could open the door for an upside move. On-chain data shows market indecision, with balanced flows between bulls and bears, signaling a lack of clear directional bias.