|

USD/JPY finds a floor at 105.26 as Trump impose tariffs on China.

  • Trump plans to impose tariffs on China, reviving trade war fears. 
  • USD/JPY is trading at the lower end of its multi-week range. 

The USD/JPY is trading at around 105.73 down 0.28% on the day as the White House takes steps to restrict Chinese investment and to put tariffs on $50B in Chinese imports for stealing technology. Any protectionist news can be interpreted by the market as USD bearish. However, so far the USD seems quite supported with the dollar index trading at 89.83 but showing signs of bull exhaustion at the time of writing.

In the US, Friday will see FOMC´s Member Bostic delivering a speech at 12.10. 

Coming up next in Japan is the National CPI dataset which is not as popular as the Tokyo CPI. 

Earlier in the US Session, we saw the Initial Jobless Claims for the week ended March 16th coming worse-than-expected while the Continuing jobless claim came in at 1.828m better than anticipated. The Housing Price Index and the Markit Manufacturing PMI in March came both above expectation.  

USD/JPY 1-hour chart

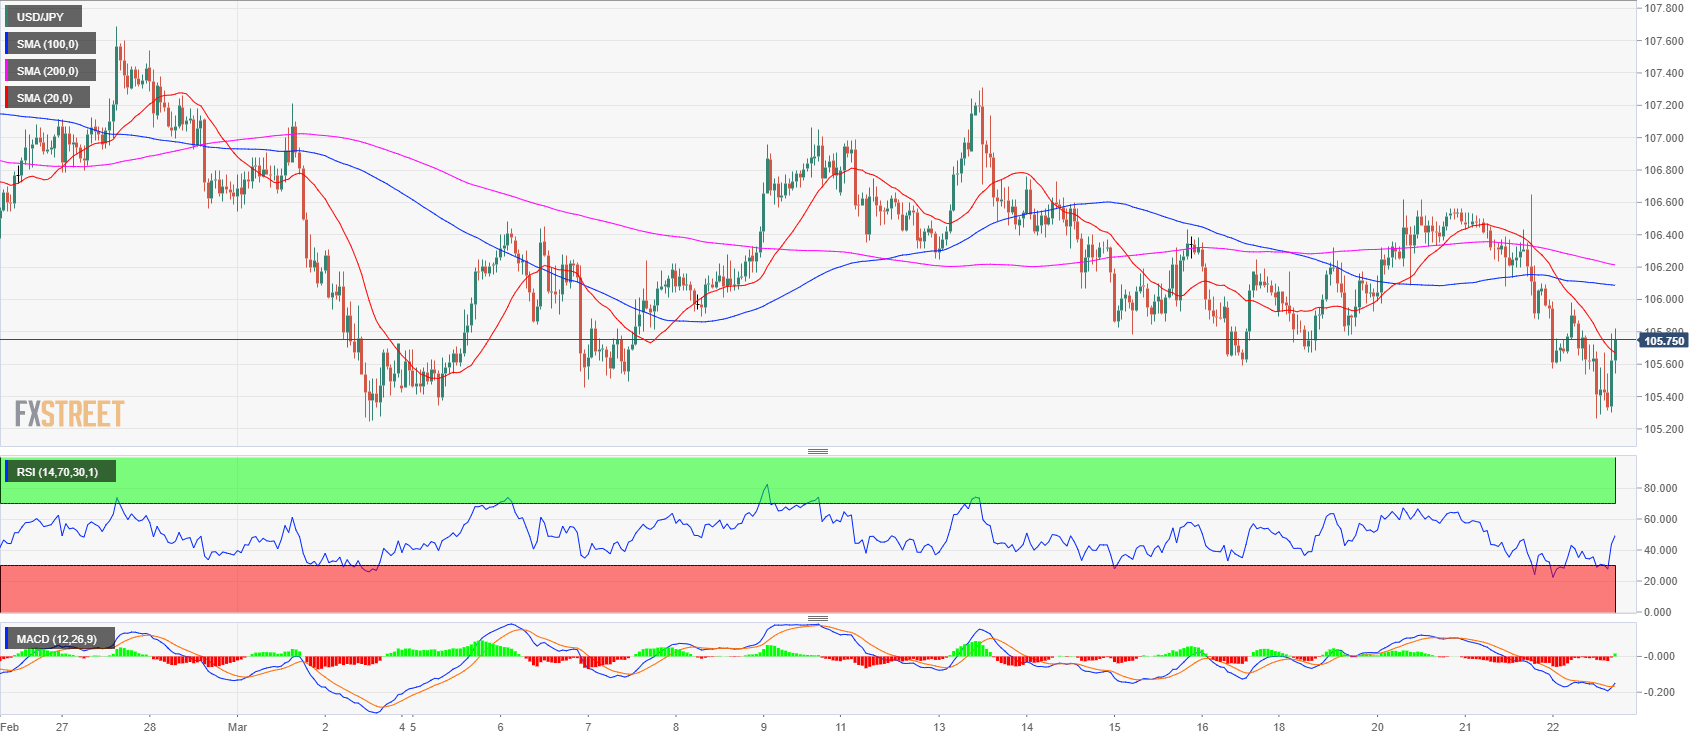
The bulls found support at the 105.26 level earlier in the European session and the market managed to bring it  up to 105.80 before finding resistance. The bulls broke above the 20 SMA which is seen as an encouraging sign for further higher prices. 

USD/JPY 5-min chart

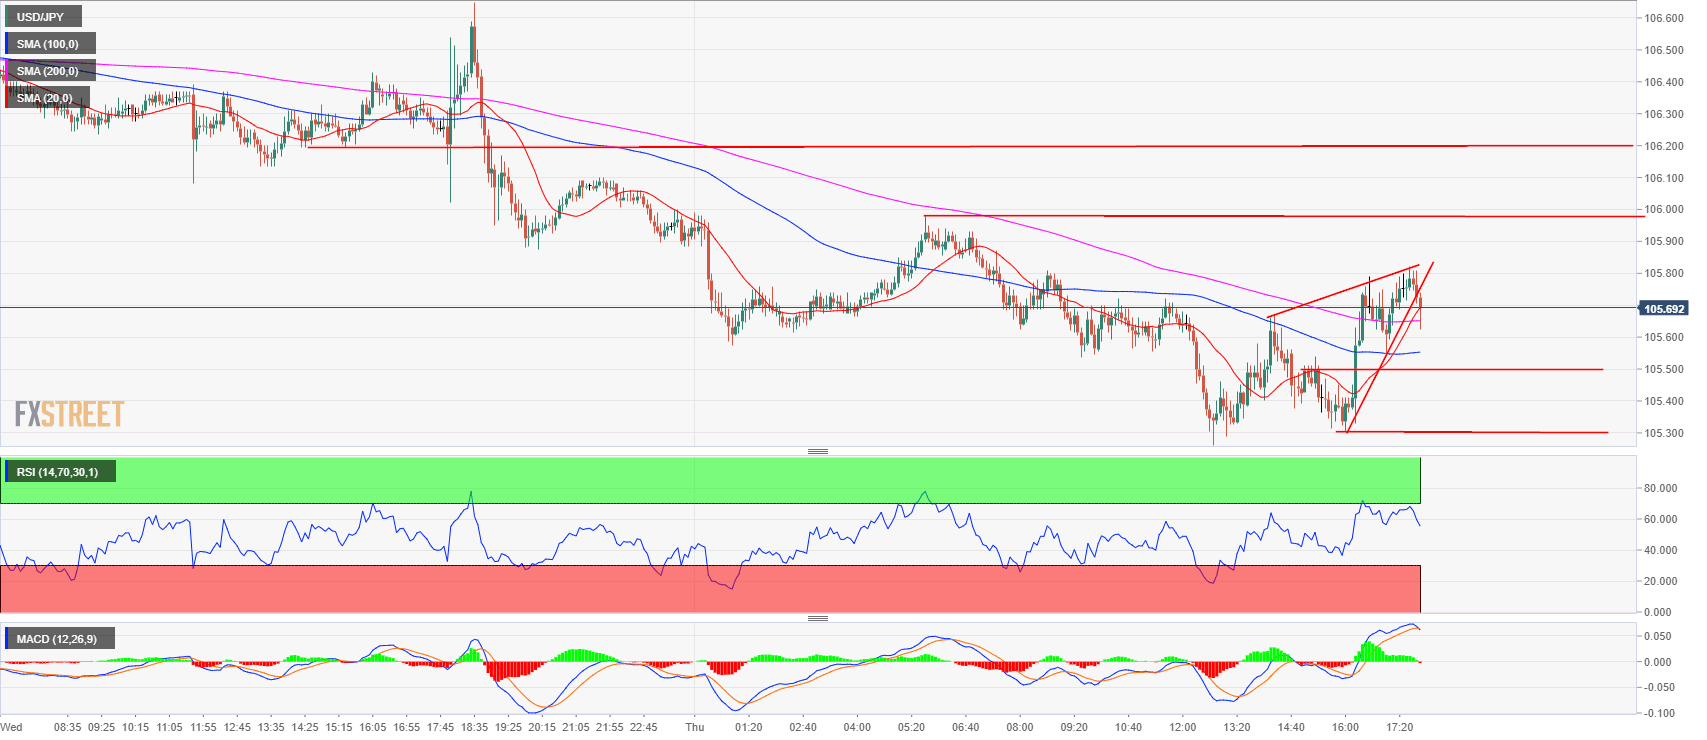
The USD/JPY on the 5-minute chart has formed a wedge pattern at the 105.80 resistance. The structure implies that we could see some resistance at this level. However, if the wedge fails we might have a breakout equal to the bull leg we say today from the bottom at 105.26. Support is seen at 105.50 previous supply zone and 105.30 previous swing low. Resistance is seen at 106 previous high and at 106.20 previous supply zone. 

Author

Flavio Tosti

Flavio Tosti

Independent Analyst


More from Flavio Tosti
Share:

Editor's Picks

EUR/USD flirts with daily highs, retargets 1.1900

EUR/USD regains upside traction, returning to the 1.1880 zone and refocusing its attention to the key 1.1900 barrier. The pair’s slight gains comes against the backdrop of a humble decline in the US Dollar as investors continue to assess the latest US CPI readings and the potential Fed’s rate path.

GBP/USD remains well bid around 1.3650

GBP/USD maintains its upside momentum in place, hovering around daily highs near 1.3650 and setting aside part of the recent three-day drop. Cable’s improved sentiment comes on the back of the Greenback’s  irresolute price action, while recent hawkish comments from the BoE’s Pill also collaborate with the uptick.

Gold clings to gains just above $5,000/oz

Gold is reclaiming part of the ground lost on Wednesday’s marked decline, as bargain-hunters keep piling up and lifting prices past the key $5,000 per troy ounce. The precious metal’s move higher is also underpinned by the slight pullback in the US Dollar and declining US Treasury yields across the curve.

Crypto Today: Bitcoin, Ethereum, XRP in choppy price action, weighed down by falling institutional interest 

Bitcoin's upside remains largely constrained amid weak technicals and declining institutional interest. Ethereum trades sideways above $1,900 support with the upside capped below $2,000 amid ETF outflows.

Week ahead – Data blitz, Fed Minutes and RBNZ decision in the spotlight

US GDP and PCE inflation are main highlights, plus the Fed minutes. UK and Japan have busy calendars too with focus on CPI. Flash PMIs for February will also be doing the rounds. RBNZ meets, is unlikely to follow RBA’s hawkish path.

Ripple Price Forecast: XRP potential bottom could be in sight

Ripple edges up above the intraday low of $1.35 at the time of writing on Friday amid mixed price actions across the crypto market. The remittance token failed to hold support at $1.40 the previous day, reflecting risk-off sentiment amid a decline in retail and institutional sentiment.