|

USD/INR Technical Analysis: Wednesday's close pivotal

  • Monday's candlestick has weakened the immediate bullish case. 
  • A close above Monday's high of 71.8090 is needed to revive the bullish setup. 

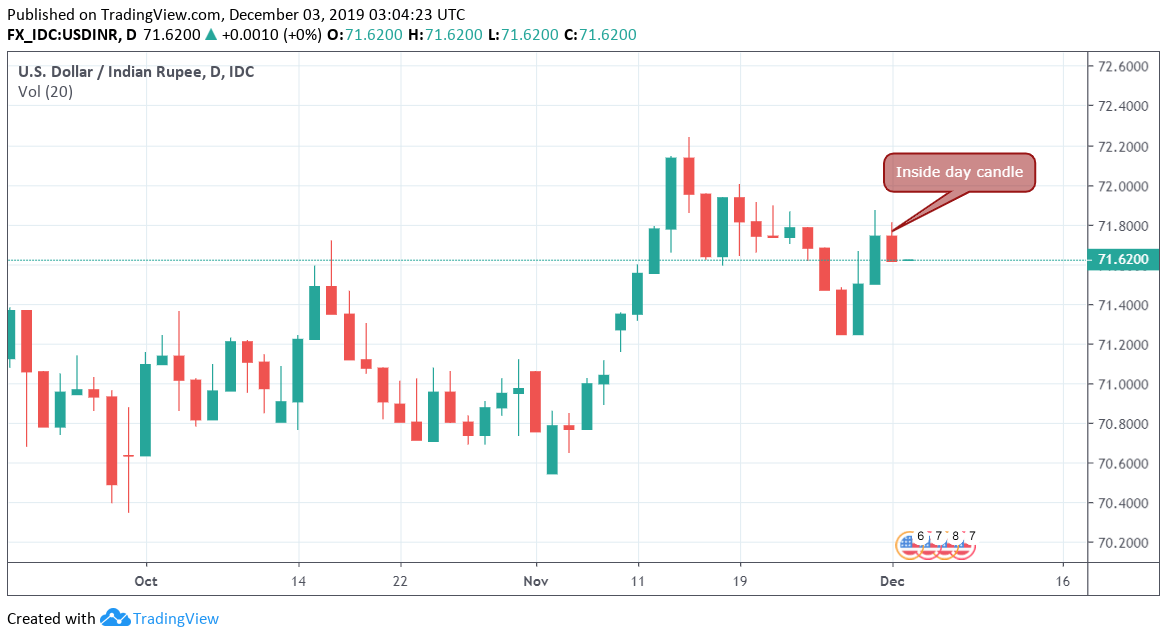
USD/INR created an inside day candlestick pattern on Monday, signaling indecision in the market place.

The candlestick pattern has weakened the immediate bullish view put forward by Friday's falling channel breakout. 

A close above 71.81 (inside day's high) would imply the indecision or consolidation has ended with a bullish breakout. Put simply, it would signal a continuation of the rally from the Nov. 28 low of 71.2490 and open the doors for a convincing move above 72.00. 

On the flip side, acceptance below the inside day's low of 71.6190 may attract stronger selling pressure. 

A bullish close looks likely as the Indian equities are likely to post losses, tracking the decline in the US stocks. 

Daily chart

Trend: Neutral

Technical levels

USD/INR

Overview
Today last price71.715
Today Daily Change0.0811
Today Daily Change %0.11
Today daily open71.6339
 
Trends
Daily SMA2071.5895
Daily SMA5071.2262
Daily SMA10070.994
Daily SMA20070.2363
 
Levels
Previous Daily High71.945
Previous Daily Low71.5885
Previous Weekly High71.8815
Previous Weekly Low71.2255
Previous Monthly High72.37
Previous Monthly Low70.4975
Daily Fibonacci 38.2%71.7247
Daily Fibonacci 61.8%71.8088
Daily Pivot Point S171.4999
Daily Pivot Point S271.366
Daily Pivot Point S371.1434
Daily Pivot Point R171.8564
Daily Pivot Point R272.079
Daily Pivot Point R372.2129

Author

Omkar Godbole

Omkar Godbole

FXStreet Contributor

Omkar Godbole, editor and analyst, joined FXStreet after four years as a research analyst at several Indian brokerage companies.

More from Omkar Godbole
Share:

Editor's Picks

EUR/USD flirts with daily highs, retargets 1.1900

EUR/USD regains upside traction, returning to the 1.1880 zone and refocusing its attention to the key 1.1900 barrier. The pair’s slight gains comes against the backdrop of a humble decline in the US Dollar as investors continue to assess the latest US CPI readings and the potential Fed’s rate path.

GBP/USD remains well bid around 1.3650

GBP/USD maintains its upside momentum in place, hovering around daily highs near 1.3650 and setting aside part of the recent three-day drop. Cable’s improved sentiment comes on the back of the Greenback’s  irresolute price action, while recent hawkish comments from the BoE’s Pill also collaborate with the uptick.

Gold clings to gains just above $5,000/oz

Gold is reclaiming part of the ground lost on Wednesday’s marked decline, as bargain-hunters keep piling up and lifting prices past the key $5,000 per troy ounce. The precious metal’s move higher is also underpinned by the slight pullback in the US Dollar and declining US Treasury yields across the curve.

Crypto Today: Bitcoin, Ethereum, XRP in choppy price action, weighed down by falling institutional interest 

Bitcoin's upside remains largely constrained amid weak technicals and declining institutional interest. Ethereum trades sideways above $1,900 support with the upside capped below $2,000 amid ETF outflows.

Week ahead – Data blitz, Fed Minutes and RBNZ decision in the spotlight

US GDP and PCE inflation are main highlights, plus the Fed minutes. UK and Japan have busy calendars too with focus on CPI. Flash PMIs for February will also be doing the rounds. RBNZ meets, is unlikely to follow RBA’s hawkish path.

Ripple Price Forecast: XRP potential bottom could be in sight

Ripple edges up above the intraday low of $1.35 at the time of writing on Friday amid mixed price actions across the crypto market. The remittance token failed to hold support at $1.40 the previous day, reflecting risk-off sentiment amid a decline in retail and institutional sentiment.