|

USD/INR technical analysis: Sellers await a break of 71.45 for fresh entry

  • USD/INR stays below 23.6% Fibonacci retracement amid near overbought RSI levels.
  • A weekly break below 71.45 could recall May month top.

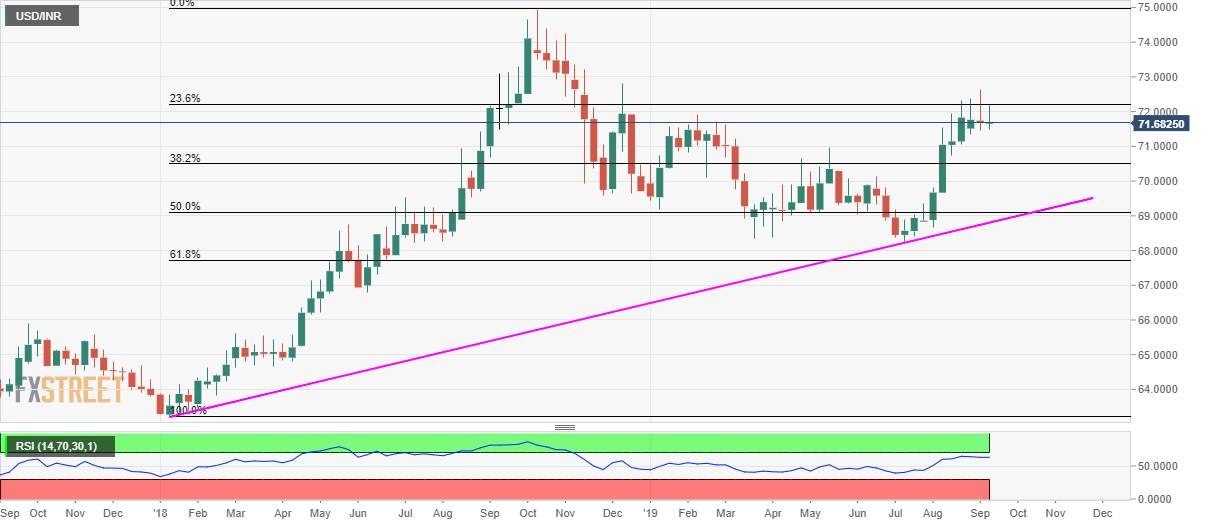
Repeated failures to cross 23.6% Fibonacci retracement of the year 2018 upside portray the USD/INR pair’s weakness as it trades near 71.7250 ahead of the European session on Wednesday.

In order to revisit May month high surrounding 71.00, a weekly closing below previous candle low of 71.45 becomes necessary while 38.2% Fibonacci retracement level of 70.50 and June month high close to 70.12, followed by 70.00 round-figure, could please bears afterward.

It should, however, be noted, that the pair’s declines below 70.00 will find it hard to sustain as 50% Fibonacci retracement level of 69.10 and 21-month-old rising trend-line near 68.80 will question pair’s further south-run.

Alternatively, pair’s weekly close above 23.6% Fibonacci retracement level of 72.20 could challenge December 2018 high of 72.82 while 73.15/20 area, including mid-October 2018 lows, holds the key to pair’s rally towards 75.00 mark.

USD/INR weekly chart

Trend: pullback expected

additional important levels

Overview
Today last price71.7355
Today Daily Change-0.1095
Today Daily Change %-0.15%
Today daily open71.845
 
Trends
Daily SMA2071.7218
Daily SMA5070.2807
Daily SMA10069.9439
Daily SMA20070.1327
Levels
Previous Daily High72.165
Previous Daily Low71.7415
Previous Weekly High72.6325
Previous Weekly Low71.4535
Previous Monthly High72.375
Previous Monthly Low68.849
Daily Fibonacci 38.2%72.0032
Daily Fibonacci 61.8%71.9033
Daily Pivot Point S171.6693
Daily Pivot Point S271.4937
Daily Pivot Point S371.2458
Daily Pivot Point R172.0928
Daily Pivot Point R272.3407
Daily Pivot Point R372.5163

Author

Anil Panchal

Anil Panchal

FXStreet

Anil Panchal has nearly 15 years of experience in tracking financial markets. With a keen interest in macroeconomics, Anil aptly tracks global news/updates and stays well-informed about the global financial moves and their implications.

More from Anil Panchal
Share:

Editor's Picks

EUR/USD hovers above 1.1800 as USD stabilizes

EUR/USD treads water above 1.1800 in the European session on Thursday. The US Dollar stabilizes, following the recent decline fuelled by concerns about the economic fallout from US President Trump's erratic trade policies, capping the pair's upside. All eyes now remain on Lagarde's speech and US-Iran nuclear talks. 

GBP/USD extends recovery to near 20-day EMA as US Dollar weakens

The Pound Sterling holds onto weekly gains around 1.3565 against the US Dollar during the Asian trading session on Thursday. The GBP/USD pair trades firmly as the US Dollar remains under pressure due to uncertainty surrounding the United States trade policy outlook.

Gold clings to gains amid sustained safe-haven flows ahead of US-Iran talks

Gold sticks to its modest intraday gains through the first half of the European session on Thursday, with bulls still awaiting a sustained move and acceptance above the $5,200 mark before placing fresh bets. 

Stellar: Relief bounce fades as bearish undertone persists

Stellar is trading around $0.16 at the time of writing on Thursday after rebounding more than 8% in the previous day. Derivatives data paints a negative picture as XLM’s short bets hit a monthly high while Open Interest continues to decline.

Nvidia delivers another monster earnings report, and forecasts big things to come

It was another monster earnings report from Nvidia for fiscal Q4. Revenues were $68.1bn, smashing estimates of $65bn. Gross profit margin was a healthy 75%, up from 73.5% in the prior quarter, and the outlook for this quarter was monstrous.

Solana strikes key resistance with double-digit gains

Solana trades at $88 at press time on Thursday, after an 11% upswing the previous day within a broader consolidation range of roughly three weeks. Institutional demand for Solana heightens as US spot SOL Exchange Traded Funds record $30 million of inflow on Wednesday.