USD/INR technical analysis: On the back foot below 21-day SMA amid bearish MACD
- USD/INR stays below immediate moving average resistance.
- Lows marked since August 08, 200-day SMA seem key supports.
- A falling trendline since early September adds to the resistance.

Sustained weakness below immediate key Simple Moving Average (SMA) keeps USD/INR sellers on the cards as the pair seesaws near 70.81 by the press time of pre-European session opening on Monday.
With the bearish signals from 12-bar Moving Average Convergence and Divergence (MACD) adding strength to downside sentiment, prices can revisit 50% Fibonacci retracement of July-September rise, at 70.44, prior revisiting 70.36/35 area that includes lows marked since August 08 and 200-day SMA level of 70.20.
During the pair’s additional weakness below 70.20, the 70.00 round-figure will be the key to watch as a failure to hold it can recall 69.40 on the chart.
Meanwhile, an upside clearance of a 21-day SMA level of 71.05 needs to be validated by the short-term falling trend line, at 71.40.
Should there be a successful rise above 71.40, monthly high near to 71.80 may have lesser chances to stay as a strong resistance.
USD/INR daily chart
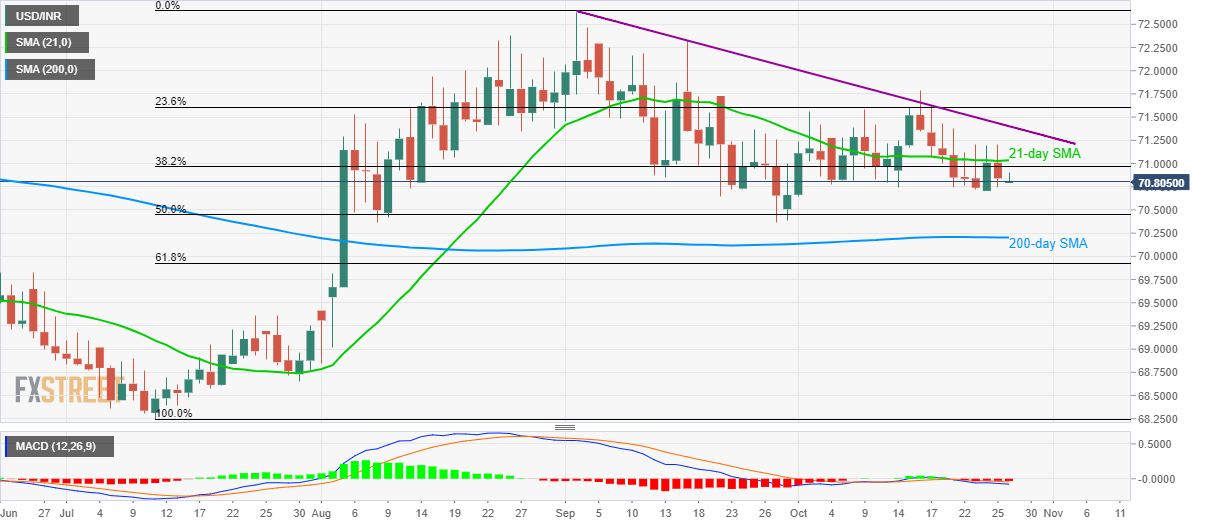
Trend: bearish
Author

Anil Panchal
FXStreet
Anil Panchal has nearly 15 years of experience in tracking financial markets. With a keen interest in macroeconomics, Anil aptly tracks global news/updates and stays well-informed about the global financial moves and their implications.


