|

USD/INR technical analysis: 68.25/26 is the level to beat for sellers amid oversold RSI

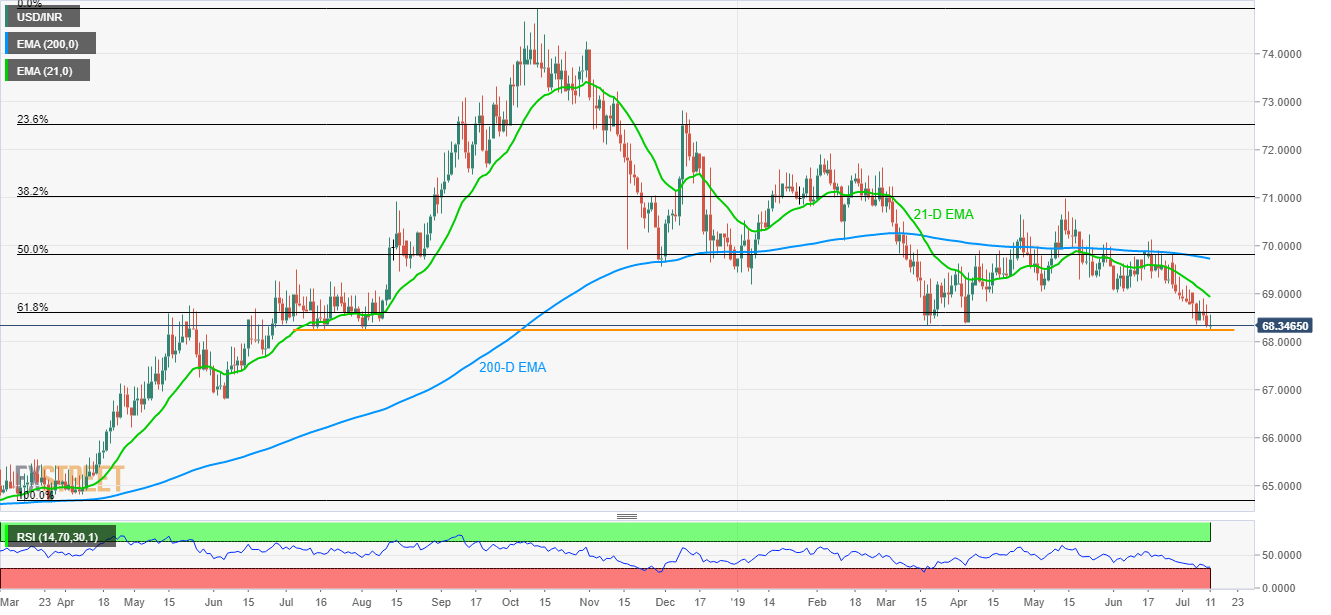
  • USD/INR drops to an 11-month low by following downward sloping 21-D EMA.
  • Year-Old horizontal support can trigger the pair’s pullback amid oversold RSI conditions.

With the USD/INR traders following a down move beneath the 21-day exponential moving average (21-D EMA), the quote drops to 11-month low while taking the rounds to 68.35 ahead of the European markets open on Thursday.

A year-long horizontal-support around 68.25/26 becomes the key for sellers amid oversold conditions of 14-day relative strength index (RSI).

As a result, prices may take a U-turn towards breaking 61.8% Fibonacci retracement of March to September 2018 rise, at 68.60 which in turn highlights the importance of 21-day EMA level of 68.93.

Given the price rally beyond 68.93, 69.03/05 horizontal area comprising May-June 2019 lows will cap further upside.

Meanwhile, a downside break of 68.25 can further strengthen bears to target 68.00 and June 2018 low surrounding 67.69.

USD/INR daily chart

Trend: Pullback expected

Additional important levels

Overview
Today last price68.3455
Today Daily Change0.0080
Today Daily Change %0.01%
Today daily open68.3375
 
Trends
Daily SMA2069.1227
Daily SMA5069.4552
Daily SMA10069.5535
Daily SMA20070.5808
Levels
Previous Daily High68.775
Previous Daily Low68.3025
Previous Weekly High69.1775
Previous Weekly Low68.365
Previous Monthly High70.1225
Previous Monthly Low68.8755
Daily Fibonacci 38.2%68.483
Daily Fibonacci 61.8%68.5945
Daily Pivot Point S168.1683
Daily Pivot Point S267.9992
Daily Pivot Point S367.6958
Daily Pivot Point R168.6408
Daily Pivot Point R268.9442
Daily Pivot Point R369.1133

Author

Anil Panchal

Anil Panchal

FXStreet

Anil Panchal has nearly 15 years of experience in tracking financial markets. With a keen interest in macroeconomics, Anil aptly tracks global news/updates and stays well-informed about the global financial moves and their implications.

More from Anil Panchal
Share:

Editor's Picks

EUR/USD climbs to daily highs near 1.1820

EUR/USD now picks up pace and advances to the area of daily peaks north of the 1.1800 barrier at the end of the week. The pair’s decent move higher comes against the backdrop of a generalised lack of direction in the FX galaxy and the mild offered stance in the US Dollar.

GBP/USD trims losses, retests 1.3460

After briefly challenging its key 200-day SMA near 1.3440, GBP/USD now manages to regain some balance and revisit the 1.3460 zone on Friday. Cable’s pullback comes as the selling pressure on the Greenback gathers traction, reigniting some recovery in the risk-linked space.

Gold flirts with four-week highs past $5,200

Gold extends its rebound, climbing for a third consecutive session and pushing back above the $5,200 mark per troy ounce on Friday. The move higher continues to draw support from lingering geopolitical tensions and the ongoing uncertainty surrounding US trade policy, both of which are keeping safe-haven demand firmly in play.

Bitcoin, Ethereum and Ripple consolidate with short-term cautious bullish bias

Bitcoin, Ethereum and Ripple are consolidating near key technical areas on Friday, showing mild signs of stabilization after recent volatility. BTC holds above $67,000 despite mild losses so far this week, while ETH hovers around $2,000 after a rejection near its upper consolidation boundary. 

Breaking: US and Israel attack Iran, risk aversion to sweep global markets

Early Saturday, United States (US) President Donald Trump announced that the US had begun “major combat operations” in Iran, following Israel’s pre-emptive missile attacks against Tehran.

Starknet unveils strkBTC, shielded Bitcoin transactions on Ethereum Layer 2

Starknet, the Ethereum Layer 2 network developed by StarkWare, today announced strkBTC, a wrapped Bitcoin asset that introduces optional shielding while preserving full DeFi composability.