USD/INR technical analysis: 50-day SMA, two-month-old trendline exert downside pressure
- USD/INR stays inside a short-term symmetrical triangle.
- 70.35, 200-day SMA and 70.00 keep sellers in check.

Following its failure to remain strong around nine-day high, mainly due to 50-day SMA, USD/INR declines to 70.97 by the press time of early Friday.
Prices are not trading southwards to a five-week-old rising trend line, at 70.70. However, pair’s further downpour will be disturbed by multiple lows marked since early August around 70.35, 200-day Simple Moving Average (SMA) level of 70.20 and 70.00 round-figure.
In a case where sellers keep the reins below 70.00, late-June high nearing 69.80 and July month top close to 69.35 will become their favorites.
On the upside, pair’s rise beyond 50-day SMA level of 71.25 could trigger fresh run-up to two-month-old falling resistance line, at 71.46, a break of which could push buyers towards October month high near 71.80.
During the pair’s extended run-up beyond 71.80, 72.40 and September month high surrounding 72.65 will be the key to watch.
USD/INR daily chart
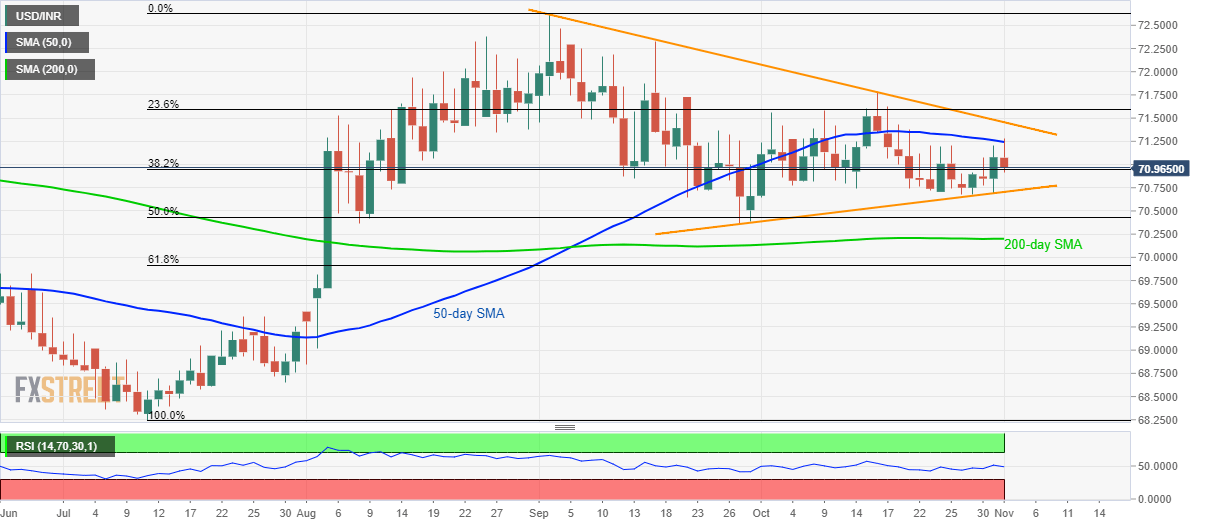
Trend: sideways
Author

Anil Panchal
FXStreet
Anil Panchal has nearly 15 years of experience in tracking financial markets. With a keen interest in macroeconomics, Anil aptly tracks global news/updates and stays well-informed about the global financial moves and their implications.


