|

USD/INR Price News: Extends its upside above 82.20 amid the USD demand

  • USD/INR gains traction around 82.28, gaining 0.02% for the day.
  • The renewed tensions between the US-China exert some pressure on the Indian Rupee (INR).
  • Softer US inflation data might convince the Federal Reserve (Fed) to adopt a less hawkish stance.
  • Moving on, market participants will closely watch the Nonfarm Payrolls (NFT report) due on Friday.

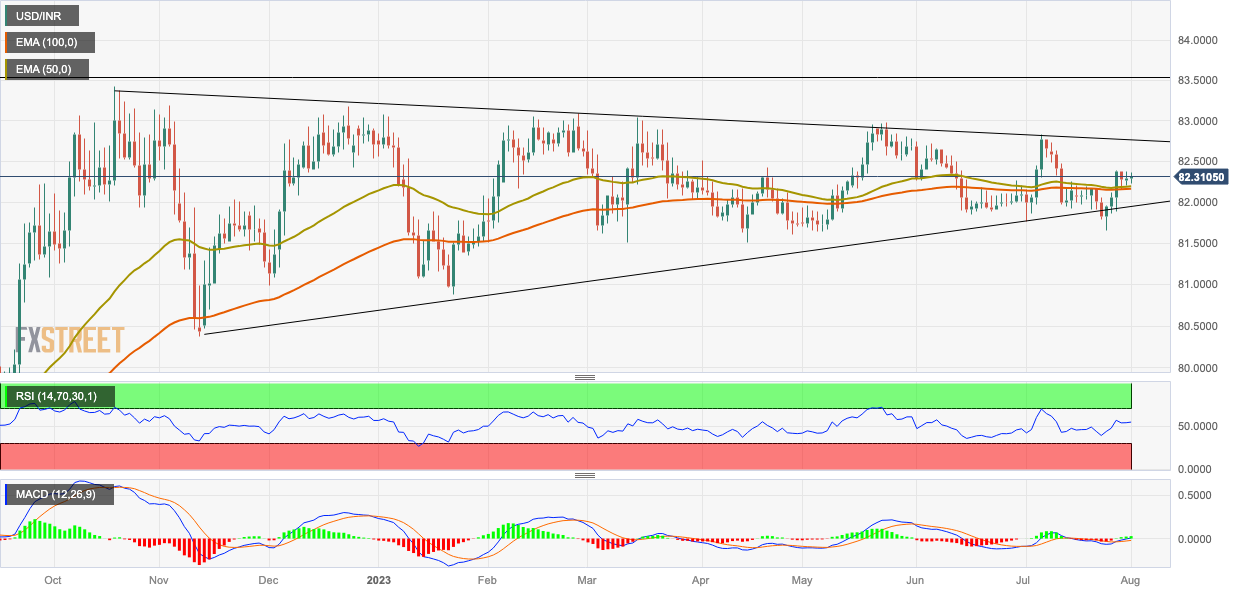
The USD/INR pair attracts some buyers during the Asian session on Tuesday. The pair currently trades within a large consolidation phase since October 2022 and holds above 82.20. The uptick in USD/INR is bolstered by the strength of the Greenback. The US dollar Index (DXY), a measure of the value of USD against a basket of six influential currencies, rebounds above the 102.00 area following last week's gains against its rivals.

The escalating tensions between the US and China over access to technology exert some pressure on the Indian Rupee (INR) and benefit the safe-haven US Dollar. On Monday, China announced export restrictions on some drones and drone-related equipment to the US, citing "national security and interests”. The restriction will go into effect on September 1, according to the commerce ministry.

On the other hand, evidence of alleviating underlying price pressures in the United States might convince the Federal Reserve (Fed) to adopt a less hawkish stance. The Personal Consumption Expenditures (PCE) Price Index decreased from 3.8% in May to 3% in June, below the market's expectation of 3.1%. While the Core PCE Price Index came in at 4.1% annually, down from 4.6% in May and below market expectations of 4.2%, The possibility of the Fed ending its rate-hiking cycle might cap the US Dollar ’s upside and act as a headwind for USD/INR.

Moving on, market participants will closely watch the Nonfarm Payrolls (NFT) report due on Friday. The US economy is expected to have created 180,000 jobs. This event could significantly impact the US Dollar's dynamic and give the USD/INR pair a clear direction. Additionally, the JOLTS Job Openings report, ADP Private Employment, Weekly Jobless Claims, and Unit Labour Cost will be released later this week.

USD/INR Technical Outlook:

From the technical perspective, two converging trend lines constitute the formation of a symmetrical triangle pattern on the daily chart. The Relative Strength Index (RSI) holds above 50, supporting the buyers for now.

Resistance levels: 82.75, 83.00, and 83.20

Support levels: 81.90, 81.70, and 81.10

USD/INR daily chart
USD/INR

Overview
Today last price82.2984
Today Daily Change0.0128
Today Daily Change %0.02
Today daily open82.2856
 
Trends
Daily SMA2082.209
Daily SMA5082.2551
Daily SMA10082.1972
Daily SMA20082.1595
 
Levels
Previous Daily High82.369
Previous Daily Low82.2
Previous Weekly High82.386
Previous Weekly Low81.6588
Previous Monthly High82.8334
Previous Monthly Low81.6588
Daily Fibonacci 38.2%82.3044
Daily Fibonacci 61.8%82.2646
Daily Pivot Point S182.2007
Daily Pivot Point S282.1159
Daily Pivot Point S382.0317
Daily Pivot Point R182.3697
Daily Pivot Point R282.4538
Daily Pivot Point R382.5387

Author

Lallalit Srijandorn

Lallalit Srijandorn is a Parisian at heart. She has lived in France since 2019 and now becomes a digital entrepreneur based in Paris and Bangkok.


More from Lallalit Srijandorn
Share:

Editor's Picks

GBP/USD revisits 1.3530; Dollar pushes harder

GBP/USD adds to the weekly correction and recedes toward the 1.3530 zone on Friday. Indeed, Cable faces increasing selling pressure on the back of extra gains in the Greenback, particularly fuelled by Chair Warsh’s speech at the Jackson Hole Symposium and the US NFP Annual Revision (-79K).

EUR/USD breaches below 1.1600, multi-day lows

EUR/USD now accelerates its decline and retreats to seven-day troughs in the sub-1.1600 region at the end of the week. The pair’s pullback comes on the back of the strong rebound in the US Dollar after Chair Warsh delivered a hawkish message in Jackson Hole, while the US NFP Annual Revision came in at -79K.

Gold challenges its 200-day SMA near $4,530

Gold’s decline gathers fresh steam, hitting weekly lows while disputing its critical 200-day SMA near $4,530 per troy ounce. The yellow metal’s increasing weakness comes in response to the generalised upbeat tone in the US Dollar and the widespread rebound in US Treasury yields, as investors continue to reprice a Fed rate hike in September.

Week ahead: RBNZ and BoC decide on rates ahead of all-important US NFP
The US dollar staged a modest recovery this week, perhaps as traders decided to cover some of their short positions amid slightly stickier or in-line US PCE inflation numbers for July, confounding expectations of softer prints amid the softness revealed in the CPI data for the month.
CFTC Report: CAD short covering leads; Gold buying surges
The week in one sentence: speculative positioning shifted more constructively in the week to August 25. CAD short covering led the move, followed by a broad reduction in EUR shorts and renewed Gold buying. GBP and VIX positioning also improved, while JPY positioning deteriorated and WTI flows diverged from weaker prices.
Diesel’s record $100 warning: The oil shock hiding in plain sight

The Oil market may look calmer than it did a few months ago, but diesel is sending a very different message. The US diesel crack spread, the premium of ultra-low sulphur diesel futures over WTI, recently surged above $100 per barrel for the first time, reaching an intraday record of just over $102.00.