|

USD/INR Price Analysis: Trades with negative bias below 83.00, lacks follow-through

  • USD/INR meets with a fresh supply on Friday and is pressured by a modest USD weakness.
  • The recent range-bound price action warrants some caution before placing directional bets.
  • A sustained strength beyond the 83.00 mark is needed to support prospects for further gains.

The USD/INR pair struggles to capitalize on the overnight solid rebound from the 82.60-82.55 area, or over a one-week low and meets with a fresh supply during the Asian session on Friday. Spot prices currently trade around the 82.75 region, down 0.15% for the day, though remain well within the striking distance of a more than six-month peak touched on Wednesday.

The downtick could be attributed to a modest US Dollar (USD) weakness and some technical selling after this week's failure to find acceptance above the 83.00 round-figure mark. Looking at the broader picture, the USD/INR pair has been oscillating in a familiar trading range over the past weeks or so. Against the backdrop of the recent rally from the 81.70 area, or the July swing low, this might still be categorized as a bullish consolidation phase.

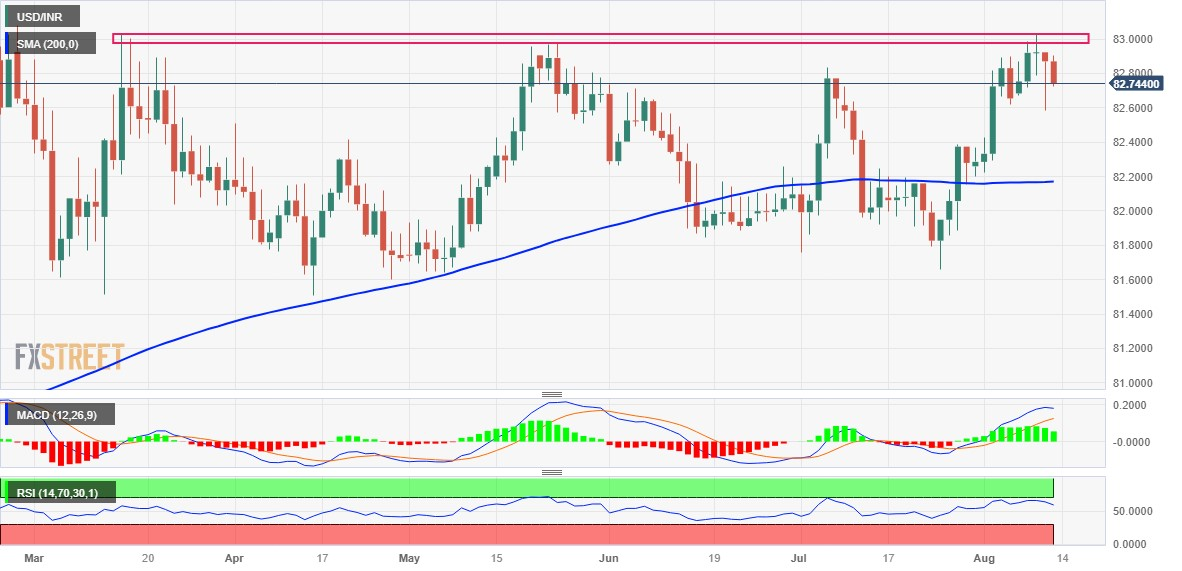
Adding to this, technical indicators on the daily chart are holding comfortably in the positive territory and suggest that the path of least resistance for the USD/INR pair is to the upside. That said, it will still be prudent to wait for a sustained strength beyond the 83.00 mark before positioning for any further gains.  Spot prices might then surpass the all-time peak, around the 83.40-83.45 region touched in October 2023, and aim to conquer the 84.00 mark.

On the flip side, a subsequent decline below the overnight swing low, around the 82.60-82.55 region, could attract fresh buyers near the very important 200-day Simple Moving Average (SMA), around the 82.20 region. This, in turn, should help limit losses for the USD/INR pair near the 82.00 mark. The latter should act as a pivotal point, which if broken decisively might shift the bias in favour of bearish traders and pave the way for a further depreciating move.

The downward trajectory might then drag the USD/INR pair below the 81.75 region, or the July swing low, towards the next relevant support near the 81.50 zone. Spot prices could eventually drop to test sub-81.00 levels or the YTD low touched in January.

USD/INR daily chart

fxsoriginal

Key levels to watch

USD/INR

Overview
Today last price82.7386
Today Daily Change-0.1319
Today Daily Change %-0.16
Today daily open82.8705
 
Trends
Daily SMA2082.3652
Daily SMA5082.2731
Daily SMA10082.216
Daily SMA20082.1679
 
Levels
Previous Daily High82.9232
Previous Daily Low82.5854
Previous Weekly High82.8996
Previous Weekly Low82.2
Previous Monthly High82.8334
Previous Monthly Low81.6588
Daily Fibonacci 38.2%82.7144
Daily Fibonacci 61.8%82.7941
Daily Pivot Point S182.6629
Daily Pivot Point S282.4552
Daily Pivot Point S382.325
Daily Pivot Point R183.0007
Daily Pivot Point R283.1308
Daily Pivot Point R383.3385

Author

Haresh Menghani

Haresh Menghani is a detail-oriented professional with 10+ years of extensive experience in analysing the global financial markets.

More from Haresh Menghani
Share:

Editor's Picks

GBP/USD flirts with two-week tops around 1.3270

GBP/USD makes a U-turn and adds to Monday’s uptick, advancing to the area of two-week highs near 1.3270 on Tuesday. Meanwhile, Cable’s better tone follows a loss of upside traction in the Greenback, always amid the sharp rally in USD/JPY.

EUR/USD stays offered, flirts with 1.1400

EUR/USD manages to reverse the early drop and now trades with marginal gains near 1.1420 on Tuesday. The pair’s recovery comes in response to some loss of momentum in the US Dollar.

Gold keeps the positive mood above $4,000

Following multi-month lows near $3,950, Gold now manages to regain some composure and reclaim the area beyond the key $4,000 yardstick per troy ounce on Wednesday. Still, any meaningful recovery appears limited as a broadly firmer US Dollar and rising US Treasury yields weigh on the yellow metal.

Ripple defends critical support, Stellar extends recovery

Ripple (XRP) trades around the key $1.00 psychological level, consolidating as the token awaits its next directional catalyst. Stellar (XLM) extends its recovery above $0.178 after posting modest gains at the start of this week.

Why a hawkish Bank of Japan could trigger the next Bitcoin sell-off

The Japanese Yen hits a 40-year low of 162.00 against the US Dollar, raising concerns about intervention or additional rate hikes by the Bank of Japan. BoJ may sell US Treasuries to buy back Yen, potentially pushing US bond yields higher and making Bitcoin less attractive to investors.

Kevin Warsh isn't expected to say much in Sintra: That's exactly why markets will listen

Financial markets could find an important catalyst in the enchanting, fairytale-like landscape of Sintra this week. The ECB Forum will, as it does every year, gather the crème de la crème of central banks. The new boss at the Fed, who has clearly said that the Fed should stop explaining everything, will need to talk – and traders should listen.