|

USD/INR Price Analysis: Indian Rupee justifies Tuesday’s Doji to tease buyers around 82.00

  • USD/INR takes offers to refresh intraday low, justifies the previous day’s Doji candlestick.
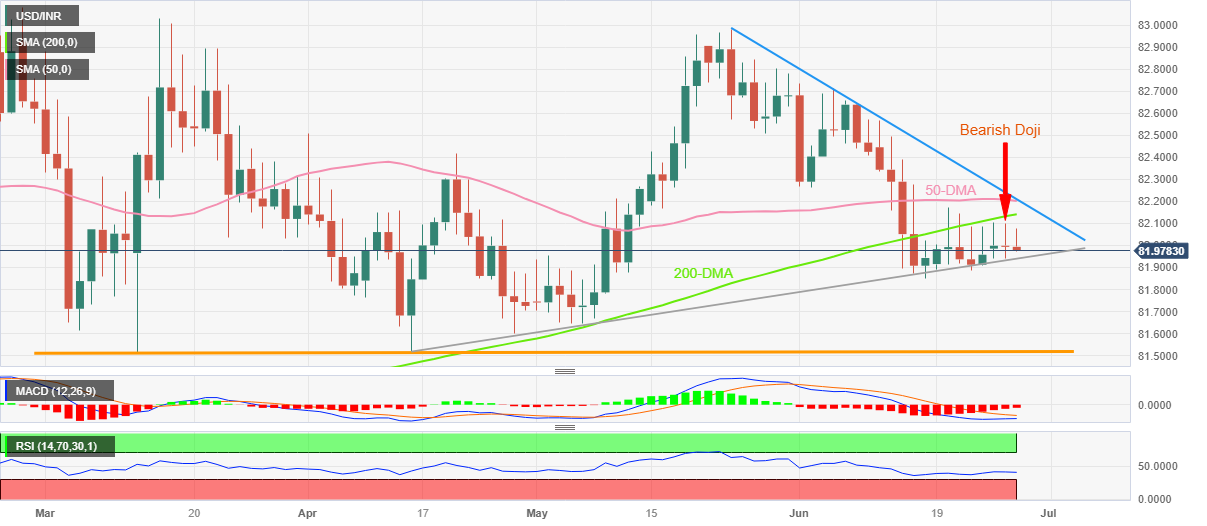
  • Bearish Doji, U-turn from 200-DMA directs Indian Rupee buyers towards 10-week-old rising trend line.
  • RSI, MACD conditions suggest limited downside room for bears to cheer.
  • Convergence of 50-DMA, one-month-old resistance line appears a tough nut to crack for USD/INR bulls.

USD/INR slips off buyer’s radar after a three-day attempt to stay firmer around 82.00, refreshing intraday low near 81.95 during very early Wednesday morning in Europe.

In doing so, the Indian Rupee (INR) pair justifies the previous day’s Bearish Doji candlestick, as well as multiple failures to cross the 200-DMA hurdle.

However, an upward-sloping support line from mid-April joins the receding bearish bias of the MACD signals and the below-50.0 levels of the RSI (14) line to challenge the USD/INR bears around 81.90.

Even if the Indian Rupee (INR) buyers manage to conquer the 81.90 support, the monthly low of around 81.85 can act as the additional downside filter before confirming the seller’s dominance.

Following that, the double bottom around 81.50 will be in the spotlight.

On the contrary, the 200-DMA guards the immediate recovery moves of the USD/INR pair around 82.15 before pushing the bulls toward confronting the 82.20 resistance confluence comprising the 50-DMA and a one-month-old falling trend line.

That said, the early month swing low of near 82.30 can act as the last defense of the USD/INR bears prior to giving control to the bulls.

USD/INR: Daily chart

Trend: Limited downside expected

Additional important levels

Overview
Today last price81.9763
Today Daily Change-0.0174
Today Daily Change %-0.02%
Today daily open81.9937
 
Trends
Daily SMA2082.2132
Daily SMA5082.2085
Daily SMA10082.2701
Daily SMA20082.1323
 
Levels
Previous Daily High82.1005
Previous Daily Low81.9393
Previous Weekly High82.1725
Previous Weekly Low81.8845
Previous Monthly High82.981
Previous Monthly Low81.6435
Daily Fibonacci 38.2%82.0009
Daily Fibonacci 61.8%82.0389
Daily Pivot Point S181.9218
Daily Pivot Point S281.85
Daily Pivot Point S381.7606
Daily Pivot Point R182.083
Daily Pivot Point R282.1724
Daily Pivot Point R382.2442

Author

Anil Panchal

Anil Panchal

FXStreet

Anil Panchal has nearly 15 years of experience in tracking financial markets. With a keen interest in macroeconomics, Anil aptly tracks global news/updates and stays well-informed about the global financial moves and their implications.

More from Anil Panchal
Share:

Markets move fast. We move first.

Orange Juice Newsletter brings you expert driven insights - not headlines. Every day on your inbox.

By subscribing you agree to our Terms and conditions.

Editor's Picks

EUR/USD moves sideways below 1.1800 on Christmas Eve

EUR/USD struggles to find direction and trades in a narrow channel below 1.1800 after posting gains for two consecutive days. Bond and stock markets in the US will open at the usual time and close early on Christmas Eve, allowing the trading action to remain subdued. 

GBP/USD keeps range around 1.3500 amid quiet markets

GBP/USD keeps its range trade intact at around 1.3500 on Wednesday. The Pound Sterling holds the upper hand over the US Dollar amid pre-Christmas light trading as traders move to the sidelines heading into the holiday season. 

Gold retreats from record highs, trades below $4,500

Gold retreats after setting a new record-high above $4,520 earlier in the day and trades in a tight range below $4,500 as trading volumes thin out ahead of the Christmas break. The US Dollar selling bias remains unabated on the back of dovish Fed expectations, which continues to act as a tailwind for the bullion amid persistent geopolitical risks.

Bitcoin slips below $87,000 as ETF outflows intensify, whale participation declines

Bitcoin price continues to trade around $86,770 on Wednesday, after failing to break above the $90,000 resistance. US-listed spot ETFs record an outflow of $188.64 million on Tuesday, marking the fourth consecutive day of withdrawals.

Economic outlook 2026-2027 in advanced countries: Solidity test

After a year marked by global economic resilience and ending on a note of optimism, 2026 looks promising and could be a year of solid economic performance. In our baseline scenario, we expect most of the supportive factors at work in 2025 to continue to play a role in 2026.

Avalanche struggles near $12 as Grayscale files updated form for ETF

Avalanche trades close to $12 by press time on Wednesday, extending the nearly 2% drop from the previous day. Grayscale filed an updated form to convert its Avalanche-focused Trust into an ETF with the US Securities and Exchange Commission.