|

USD/INR Price Analysis: Flat-lines around 82.50, bulls still seem to have the upper hand

  • USD/INR is seen consolidating in a narrow band around mid-82.00s on Friday.
  • The technical setup favours bulls and supports prospects for additional gains.
  • A convincing break below the 200- SMA is needed to negate the positive bias.

The USD/INR pair oscillates in a narrow trading band through the Asian session on Friday and is currently placed around the 82.50 region, nearly unchanged for the day.

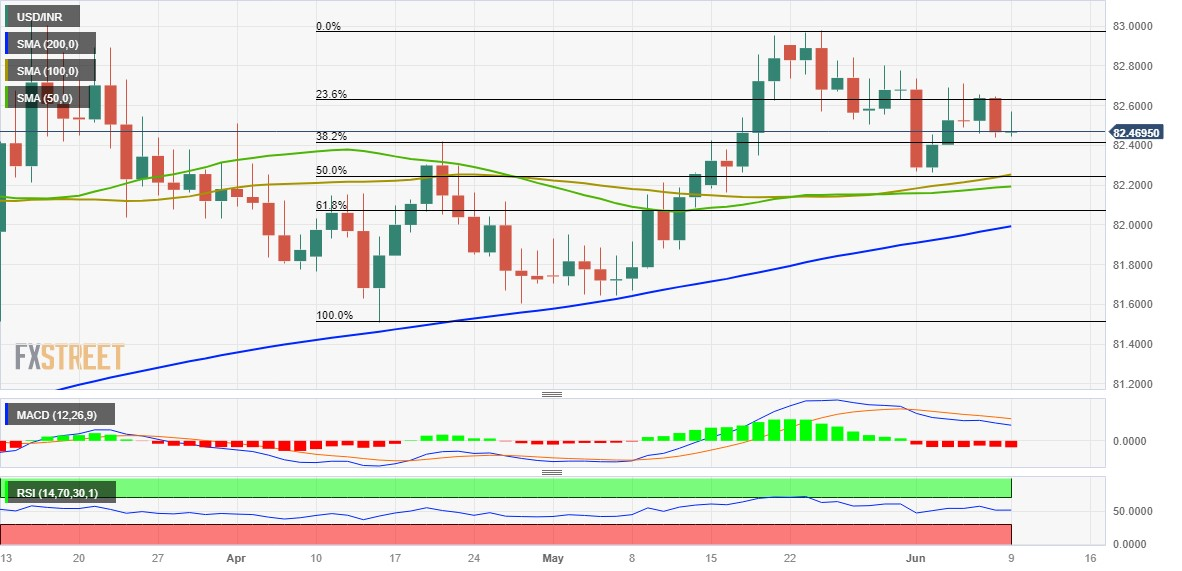
From a technical perspective, spot prices, so far, manage to hold above the 38.2% Fibonacci retracement level of the April-May rally from the vicinity of the very important 200-day Simple Moving Average (SMA). Against the backdrop of last week's bounce from the 50% Fibo. level, positive oscillators on the daily chart support prospects for some near-term appreciating move.

That said, it will still be prudent to wait for some follow-through buying beyond the 23.6% Fibo. level, around the 82.65 region, before placing fresh bullish bets. The USD/INR pair might then make a fresh attempt to conquer the 83.00 round-figure mark. A sustained strength and acceptance above the latter will confirm a fresh breakout, paving the way for additional gains.

On the flip side, weakness below the 82.40 region, or the 38.2% Fibo. level, might prompt some technical selling and expose the 82.25 confluence - comprising 50% Fibo. level and the 100-day Simple Moving Average (SMA). A convincing break below will make the USD/INR pair vulnerable to challenge the 200-day SMA, currently pegged around the 82.00 mark.

The aforementioned handle should act as a pivotal point, which if broken decisively will negate the positive outlook and shift the near-term bias in favour of bearish traders.

USD/INR daily chart

fxsoriginal

Key levels to watch

USD/INR

Overview
Today last price82.4708
Today Daily Change0.0042
Today Daily Change %0.01
Today daily open82.4666
 
Trends
Daily SMA2082.5699
Daily SMA5082.188
Daily SMA10082.2389
Daily SMA20081.9792
 
Levels
Previous Daily High82.6478
Previous Daily Low82.4386
Previous Weekly High82.8046
Previous Weekly Low82.2615
Previous Monthly High82.981
Previous Monthly Low81.6435
Daily Fibonacci 38.2%82.5185
Daily Fibonacci 61.8%82.5679
Daily Pivot Point S182.3875
Daily Pivot Point S282.3084
Daily Pivot Point S382.1783
Daily Pivot Point R182.5968
Daily Pivot Point R282.7269
Daily Pivot Point R382.806

Author

Haresh Menghani

Haresh Menghani is a detail-oriented professional with 10+ years of extensive experience in analysing the global financial markets.

More from Haresh Menghani
Share:

Editor's Picks

EUR/USD: Breakdown below trading range support near 1.1770 comes into play

The EUR/USD pair opens with a bearish gap at the start of a new week as the US-Iran war-led global flight to safety boosts the US Dollar. Spot prices, however, lack follow-through selling and manage to hold above mid-1.1700s during the Asian session.

GBP/USD targets 1.3500 barrier near moving averages

GBP/USD rebounds from the daily losses, trading around 1.3450 during the Asian hours on Monday. The technical analysis of the daily chart indicates an ongoing bearish bias, as the pair trades within a descending channel pattern.

Gold jumps over 2% toward $5,400 after US, Israel attack Iran

Gold is on fire at the start of the week, a widely expected move, as investors seek harbor in the traditional store of value, following the continued US and Israel attacks on Iran. The bright metal opened with a bullish gap of about $17 and rallied toward the $5,400 level as Asian traders hit their desks and reacted negatively to the weekend news of the Middle East conflict, rushing for cover in Gold.

Top Crypto Losers: Tezos, Toncoin, and Polkadot at crucial levels amid US-Israel strike on Iran

Altcoins such as Tezos, Toncoin, and Polkadot rank among the worst hit cryptocurrencies over the last 24 hours amid the US and Israel's attack on Iran. Tezos and Toncoin are down to crucial support levels while Polkadot remains near a crucial resistance trendline, showcasing underlying strength.

The market is paying for insurance, not apocalypse

As expected, this morning felt less like a Monday market open and more like a fire drill. Futures screens flickered red. S&P contracts down almost 1%. Nasdaq off 1.2%. Brent leaped 13% through $80. Gold rose 1.6% toward $5350 before paring some gains. The dollar is strutting mildly. The Swiss franc is quietly doing what it always does in a storm, catching some safe-haven flows.

Starknet unveils strkBTC, shielded Bitcoin transactions on Ethereum Layer 2

Starknet, the Ethereum Layer 2 network developed by StarkWare, today announced strkBTC, a wrapped Bitcoin asset that introduces optional shielding while preserving full DeFi composability.