|

USD/INR Price Analysis: Eyes on the 82.00 area for the next move

  • USD/INR lacks firm directional bias; market players await a valid breakout.
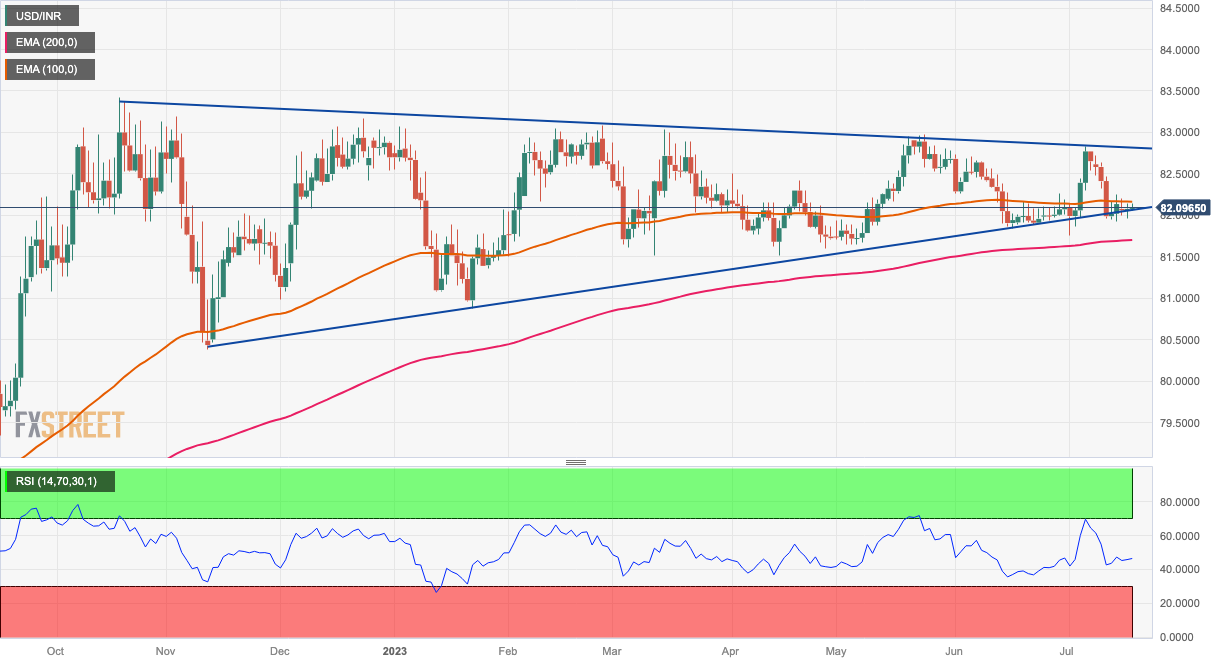
  • The currency cross gyrates within a symmetrical triangle pattern on the daily chart.
  • The key support level is seen at 82.00, while 82.80 area acts as the immediate resistance level.

The USD/INR pair lacks any firm directional bias and oscillates within a large consolidation phase since October 2022. The cross currently trades around 82.10 during the Asian session on Wednesday. 

That said, two converging trend-lines constitute the formation of a symmetrical triangle pattern on the daily chart. Market participants await a valid breakout for the next directional move for the cross. Meanwhile, the Relative Strength Index (RSI) holds between 40-60, reinforcing the non-directional movement for USD/INR.

A decisive break below 82.00 (the lower limit of the asymmetrical triangle pattern, a psychological round mark) will see a drop to a crucial support level of 81.70. The mentioned level represents the 200-day Exponential Moving Average (EMA). The additional downside filter to watch is 80.85 (Low of January 23, 2023), followed by 80.35, representing a low of November 11, 2022. 

On the upside, any meaningful follow-through buying past 82.80 (the upper boundary of the asymmetrical triangle pattern) will challenge the next contention at 83.00, portraying a psychological round mark and a low of May 24. Further north, the cross will meet the next hurdle near 83.20 (High of December 23, 2022) en route to 83.40 (High of October 19, 2022).

USD/INR daily chart

USD/INR

Overview
Today last price82.0806
Today Daily Change0.0025
Today Daily Change %0.00
Today daily open82.0781
 
Trends
Daily SMA2082.1567
Daily SMA5082.3106
Daily SMA10082.1955
Daily SMA20082.1764
 
Levels
Previous Daily High82.1456
Previous Daily Low81.9675
Previous Weekly High82.7256
Previous Weekly Low81.9215
Previous Monthly High82.737
Previous Monthly Low81.8477
Daily Fibonacci 38.2%82.0776
Daily Fibonacci 61.8%82.0356
Daily Pivot Point S181.9819
Daily Pivot Point S281.8856
Daily Pivot Point S381.8037
Daily Pivot Point R182.16
Daily Pivot Point R282.2419
Daily Pivot Point R382.3382

Author

Lallalit Srijandorn

Lallalit Srijandorn is a Parisian at heart. She has lived in France since 2019 and now becomes a digital entrepreneur based in Paris and Bangkok.

More from Lallalit Srijandorn
Share:

Markets move fast. We move first.

Orange Juice Newsletter brings you expert driven insights - not headlines. Every day on your inbox.

By subscribing you agree to our Terms and conditions.

Editor's Picks

EUR/USD struggles to extend advance above 1.1800

The EUR/USD pair posts a fresh weekly low near 1.1740 during the Asian trading session on Wednesday. The major currency pair is under pressure as the US Dollar edges higher despite Federal Open Market Committee minutes of the December policy meeting, released on Tuesday, showing that most policymakers stressed the need for further interest rate cuts.

GBP/USD tests 1.3450 support after moving below nine-day EMA

GBP/USD remains subdued for the second consecutive day, trading around 1.3460 during the Asian hours on Wednesday. The technical analysis of the daily chart indicates a weakening of a bullish bias as the pair is positioned slightly below the lower boundary of the ascending channel pattern.

Gold jumps on US rate cut prospects, safe-haven demand

Gold price extends the rally above $4,350 during the early European trading hours on Wednesday. Gold's price has surged about 65% this year and is set to record its biggest annual gains since 1979. The rally in the precious metal is bolstered by the prospect of further US interest rate cuts in 2026. Lower interest rates could reduce the opportunity cost of holding Gold, supporting the non-yielding precious metal.

Bitcoin, Ethereum and XRP prepare for a potential New Year rebound

Bitcoin, Ethereum, and Ripple are holding steady on Wednesday after recording minor gains on the previous day. Technically, Bitcoin could extend gains within a triangle pattern while Ethereum and Ripple face critical overhead resistance. 

Economic outlook 2026-2027 in advanced countries: Solidity test

After a year marked by global economic resilience and ending on a note of optimism, 2026 looks promising and could be a year of solid economic performance. In our baseline scenario, we expect most of the supportive factors at work in 2025 to continue to play a role in 2026.

Crypto market outlook for 2026

Year 2025 was volatile, as crypto often is.  Among positive catalysts were favourable regulatory changes in the U.S., rise of Digital Asset Treasuries (DAT), adoption of AI and tokenization of Real-World-Assets (RWA).