|

USD/INR New York Price Forecast: Greenback knocking at the 76.00 resistance vs. Indian rupee

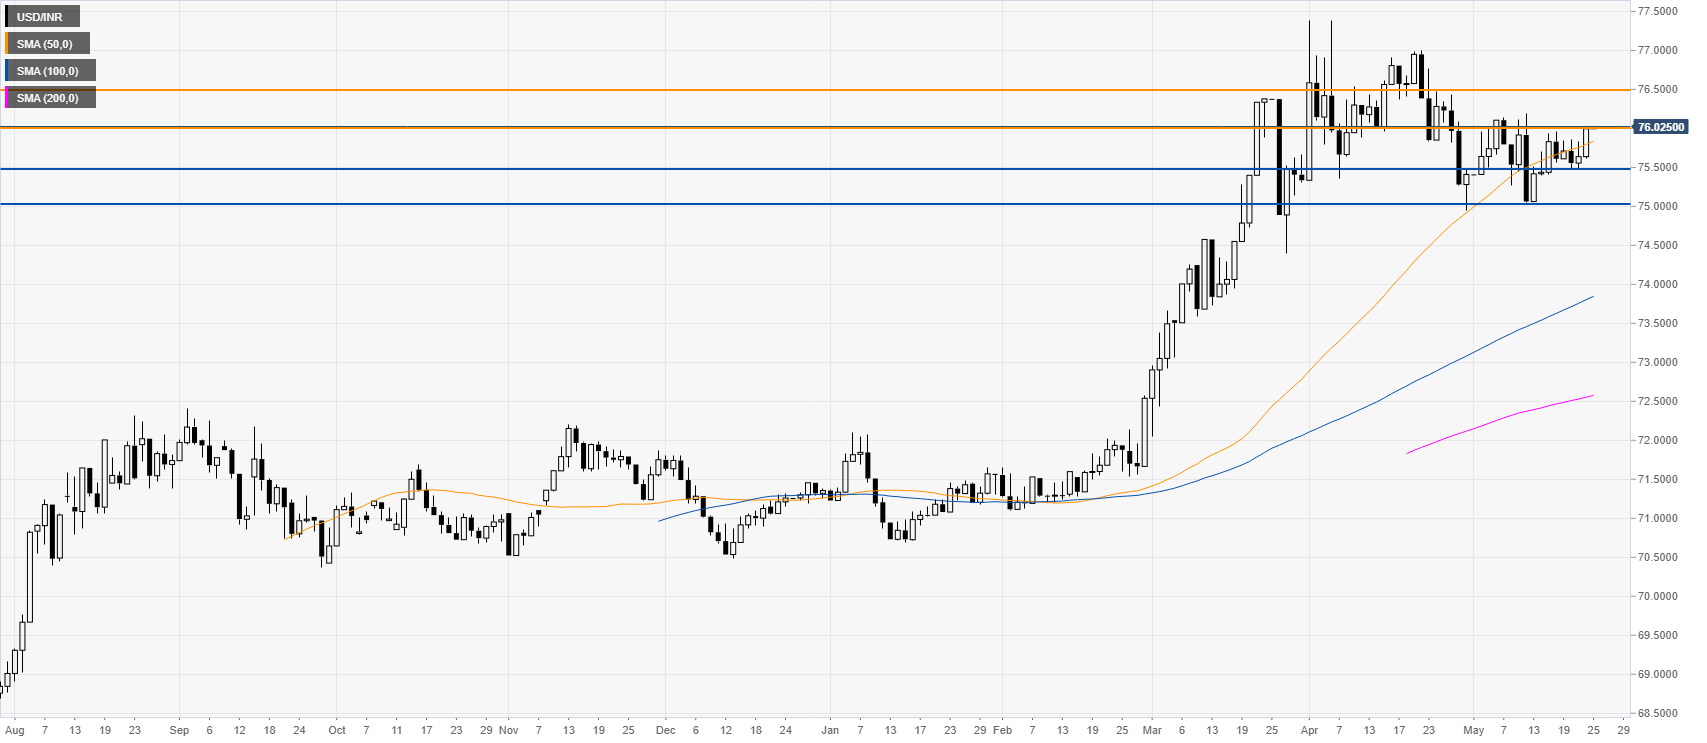
  • USD/INR is challenging the 76.00 resistance as the New York forex session is starting.
  • A daily close above the 76.00 level can be seen as bullish. 
 

USD/INR daily chart

 
USD/INR is testing the 76.00 figure while above the main SMAs on the daily chart. The bulls remain in charge at the start of the new trading week. A close above the 76.00 resistance on a daily closing basis should lead to more upside potential with 76.50 as a possible target. On the other hand, a break below the 75.50 support can lead to more down in the medium-term.
  

Additional key levels

USD/INR

Overview
Today last price76.025
Today Daily Change0.0299
Today Daily Change %0.04
Today daily open75.9951
 
Trends
Daily SMA2075.6864
Daily SMA5075.7852
Daily SMA10073.8282
Daily SMA20072.5673
 
Levels
Previous Daily High76.0223
Previous Daily Low75.62
Previous Weekly High76.0223
Previous Weekly Low75.4707
Previous Monthly High76.975
Previous Monthly Low75.14
Daily Fibonacci 38.2%75.8686
Daily Fibonacci 61.8%75.7737
Daily Pivot Point S175.736
Daily Pivot Point S275.4768
Daily Pivot Point S375.3337
Daily Pivot Point R176.1383
Daily Pivot Point R276.2814
Daily Pivot Point R376.5406

Author

Flavio Tosti

Flavio Tosti

Independent Analyst


More from Flavio Tosti
Share:

Editor's Picks

EUR/USD appears supported by the 200-day SMA, for now

Following an early pullback to multi-week lows near 1.1670, EUR/USD now manages to reclaim the 1.1700 region as the NA session draws to a close on Monday. The steep retracement in spot follows the equally strong move higher in the US Dollar, as investors continue to assess the geopolitical landscape in the wake of the US and Israel attacks on Iran.


GBP/USD hits new yearly lows near 1.3300

GBP/USD adds to the recent bearish tone, approaching to the key 1.3300 support to reach fresh YTD troughs against the backdrop of the robust performance of the US Dollar. Indeed, Cable’s decline comes amid the firm demand for the safe-haven space in the wake of the US and Israel attacks to Iran.

Gold eases some ground, approaches $5,300

Gold now surrenders part of the earlier advance, reshifting its attenton to the $5,300 zone per troy ounce at the beginning of the week. Indeed, the yellow metal’s firm performance appears propped up by incresing geopolitical jitters in the Middle East, which at the same time fuels the demand for the safe-haven space.

Strategy lifts holdings to 3.4% of Bitcoin's total supply amid inflows into crypto products

Strategy continued its accumulation of the top crypto last week, acquiring 3,015 BTC for $204 million amid renewed interest in crypto products after four weeks of outflows.

The Fed is finally talking about AI – Here's why it matters for the US Dollar

AI is moving from earnings calls into the heart of monetary policy discussions, forcing Federal Reserve officials to confront a new question: How to act if AI reshapes inflation, employment and interest rates at the same time?

Grass 20% bullish breakout defies broader market weakness

Grass (GRASS) is edging up above $0.30 at the time of writing on Monday. The token’s notable 20% intraday surge stands out amid heightened volatility in the broader crypto market.