|

USD/INR hovers around 75.00 at make or break level

  • USD/INR has slipped near 74.90 as geopolitical tensions ease off.
  • The Indian rupee is underpinned against the greenback as the Asian markets rebound.
  • The DXY has remained subdued amid a better mood and ahead of Fedspeak.

The USD/INR pair has fallen sharply on Friday as investors cheer the meeting between US Secretary Antony Blinken and Russian Foreign Minister Sergei Lavrov, scheduled for late next week.

The acceptance of a meeting by the US on a stipulation that there is no further Russian invasion of Ukraine, as noted by the US State Department, supports the global markets and turns the sentiment positive. The risk-sensitive Indian rupee has appreciated against the safe-haven greenback.

Meanwhile, the US dollar index (DXY) has remained subdued in Friday's Asian session, in part due to the shift in the market's risk perception, as hopes for diplomacy over the Ukrainian concerns resurface. 

The ongoing geopolitical concerns have also led to diminishing expectations of an aggressive rate hike by the Federal Reserve (Fed), which is due in March, as inflation is not the only factor that the Fed may consider before dictating monetary policy.

It is highly likely that the USD/INR pair will action mainly upon the headlines from the Russia-Ukraine tussle, as the economic calendar has nothing much to offer on Friday.

USD/INR Technical Analysis

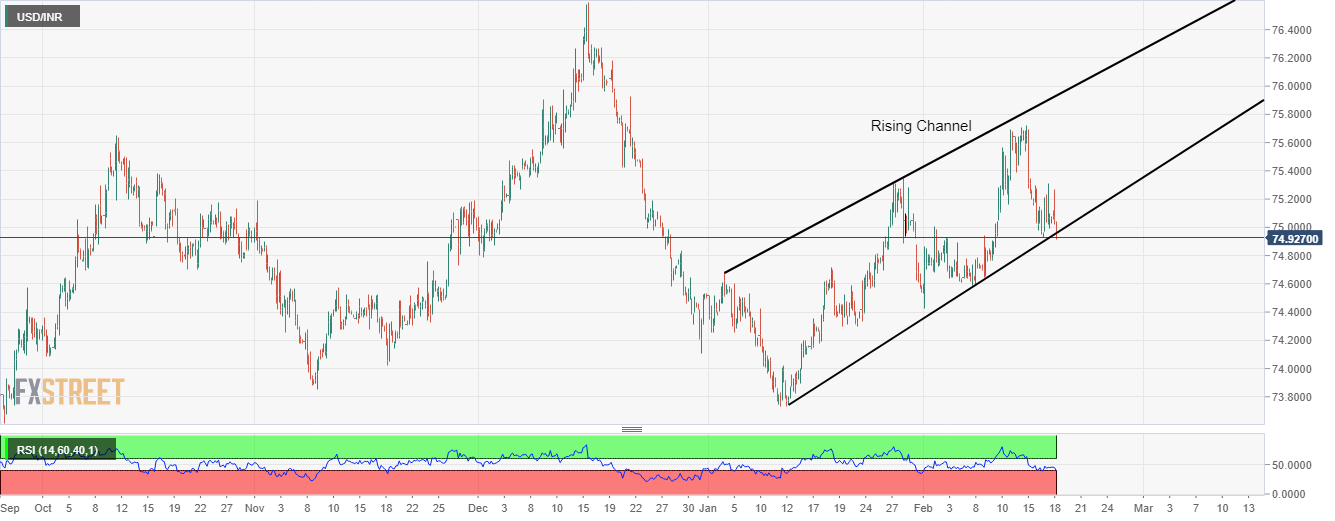
On a four-hour chart, USD/INR is trading in a rising channel. The asset has slipped below the lower trendline placed from January 12 low at 73.73, which is indicating weakness going further. The Relative Strength Index (RSI) (14) is on the verge of skidding below 40.00, which may bring some significant offers by the market participants.

USD/INR four-hour chart

USD/INR

Overview
Today last price74.8965
Today Daily Change-0.1873
Today Daily Change %-0.25
Today daily open75.0838
 
Trends
Daily SMA2074.9257
Daily SMA5074.8876
Daily SMA10074.8391
Daily SMA20074.3437
 
Levels
Previous Daily High75.313
Previous Daily Low74.9299
Previous Weekly High75.6899
Previous Weekly Low74.5868
Previous Monthly High75.3425
Previous Monthly Low73.7283
Daily Fibonacci 38.2%75.1667
Daily Fibonacci 61.8%75.0762
Daily Pivot Point S174.9048
Daily Pivot Point S274.7258
Daily Pivot Point S374.5217
Daily Pivot Point R175.2879
Daily Pivot Point R275.492
Daily Pivot Point R375.671

Author

More from FXStreet Team
Share:

Editor's Picks

EUR/USD holds losses near 1.1850 as US, China holidays keep trade muted

EUR/USD opens the week on a softer note, trading near 1.1860 during the Asian session on Monday. Activity is likely to remain muted, with United States markets closed for the Presidents’ Day holiday, while Mainland China is also shut for the week-long Lunar New Year break.

GBP/USD flat lines as traders await key UK macro data and FOMC minutes

The GBP/USD pair kicks off a new week on a subdued note and oscillates in a narrow range, just below mid-1.3600s, during the Asian session. Moreover, the mixed fundamental backdrop warrants some caution for aggressive traders as the market focus now shifts to this week's important releases from the UK and the US.

Gold remains below $5,050 despite Fed rate cut bets, uncertain geopolitical tensions

Gold edges lower after registering over 2% gains in the previous session, trading around $5,030 per troy ounce during the Asian hours on Monday. However, the non-interest-bearing Gold could further gain ground following softer January Consumer Price Index figures, which reinforced expectations that the Federal Reserve could cut rates later this year.

Top Crypto Losers: Dogecoin, Zcash, Bonk – Meme and Privacy coins under pressure

Meme coins such as Dogecoin and Bonk, alongside the privacy coin Zcash (ZEC), are leading the broader market losses over the last 24 hours. DOGE, ZEC, and BONK ended their three consecutive days of recovery with a sudden decline on Sunday, as crucial resistance levels capped the gains. Technically, the altcoins show downside risk, starting the week under pressure.

Global inflation watch: Signs of cooling services inflation

Realized inflation landed close to expectations in January, as negative base effects weighed on the annual rates. Remaining sticky inflation is largely explained by services, while tariff-driven goods inflation remains limited even in the US.

Ripple Price Forecast: XRP potential bottom could be in sight

Ripple edges up above the intraday low of $1.35 at the time of writing on Friday amid mixed price actions across the crypto market. The remittance token failed to hold support at $1.40 the previous day, reflecting risk-off sentiment amid a decline in retail and institutional sentiment.