|

USD Index Price Analysis: Next on the downside comes 100.80

  • DXY keeps the side-lined trading well in place on Friday.
  • The breakdown of this theme exposes a drop to the YTD low.

DXY trades without clear direction below the 102.00 region at the end of the week.

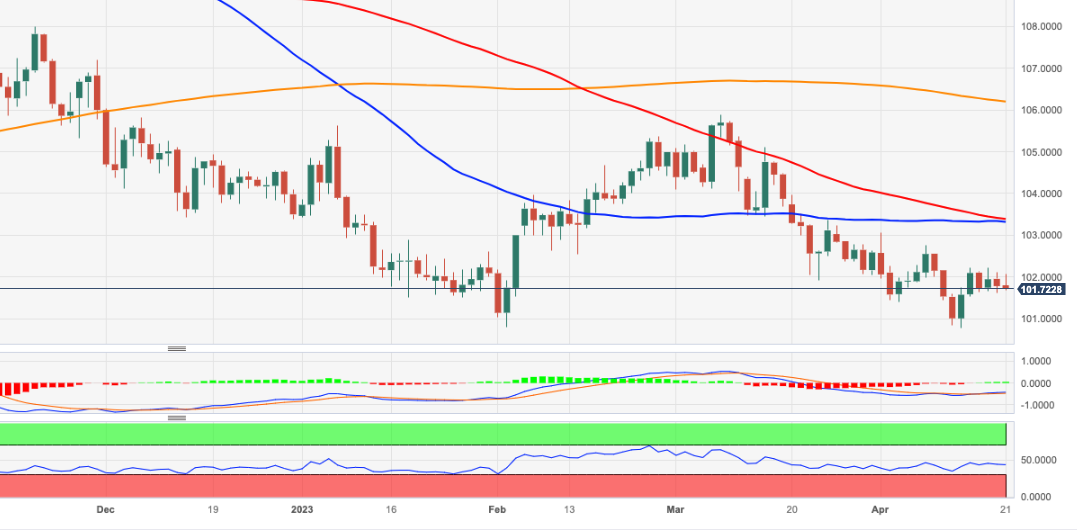
The index maintains the choppy activity well in place so far this week. Occasional bouts of weakness could spark a potential decline to the 2023 lows in the 100.80/75 band (April 14) ahead of the psychological support at the 100.00 mark.

Looking at the broader picture, while below the 200-day SMA, today at 106.21, the outlook for the index is expected to remain negative.

DXY daily chart

Dollar Index Spot

Overview
Today last price101.77
Today Daily Change38
Today Daily Change %-0.01
Today daily open101.78
 
Trends
Daily SMA20102.09
Daily SMA50103.34
Daily SMA100103.42
Daily SMA200106.29
 
Levels
Previous Daily High102.12
Previous Daily Low101.63
Previous Weekly High102.76
Previous Weekly Low100.79
Previous Monthly High105.89
Previous Monthly Low101.92
Daily Fibonacci 38.2%101.82
Daily Fibonacci 61.8%101.94
Daily Pivot Point S1101.57
Daily Pivot Point S2101.36
Daily Pivot Point S3101.08
Daily Pivot Point R1102.06
Daily Pivot Point R2102.34
Daily Pivot Point R3102.55

Author

Pablo Piovano

Born and bred in Argentina, Pablo has been carrying on with his passion for FX markets and trading since his first college years.

More from Pablo Piovano
Share:

Editor's Picks

AUD/USD falls to near 0.7100 after slipping below 50-day EMA

AUD/USD depreciates after registering minor gains in the previous day, trading around 0.7120 during the Asian hours. The technical analysis of the daily chart shows the pair consolidating sideways within a rectangle pattern, as neither bulls nor bears gain control. The AUD/USD pair is holding a slight bearish tone however as it sits beneath both the nine-day and 50-day EMAs.

USD/JPY consolidates near 160.00 as US NFP takes centre stage

The USD/JPY pair trades in a tight range around 160.00 during the European trading session. The pair wobbles as investors await the United States Nonfarm Payrolls data for May, which will be published at 12:30 GMT. Investors will closely monitor the employment data to get fresh cues regarding the Federal Reserve’s monetary policy outlook.

Gold remains offered below $4,500 following US Payrolls

Gold prices trade with a bearish bias and still remain below the key $4,500 mark per troy ounce at the end of the week. The slighlty softer tone in the US Dollar alongside mixed US Treasury yields across the curve also keep the yellow metal’s downside somewhat contained.


Cardano hits five-year low even as Hoskinson clarifies "break" isn't an exit

Cardano (ADA) price is down 10% at press time on Friday, extending losses over 30% so far this week amid Charles Hoskinson's clarification that "break" isn't an exit.

Week ahead – Fed countdown begins amid US inflation data and geopolitical risks

Fed Chair Warsh’s first meeting approaches as key US inflation data could reshape expectations. Oil prices remain elevated as US-Iran talks continue; tariffs also return to the spotlight. ECB is expected to hike; will it be a one-off move or is July live?

The US economy defies the rules: 100 days into the Oil shock and the recession signal is still missing

More than three months after the start of the Iran war and the resulting disruption to global energy markets, the US economy continues to display remarkable resilience. The conflict has triggered a sharp rise in Oil prices, reignited inflationary pressures and fueled widespread concerns about a potential economic slowdown.