|

USD Index Price Analysis: Losses could accelerate below 102.60

  • The index remains on the defensive in the first half of the week.
  • Next on the downside emerges the 102.60 zone.

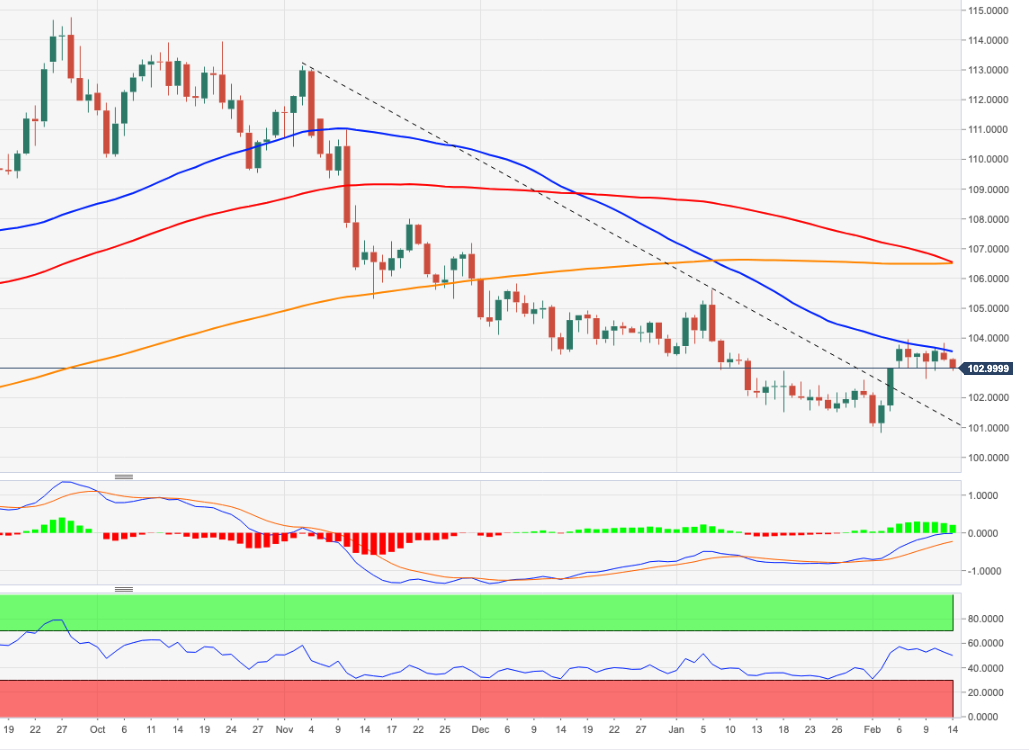
DXY adds to the bearish note recorded on Monday and puts the 103.00 support level to the test on Tuesday.

The recent price action leaves the door open to the continuation of the consolidative phase for the time being. However, a drop below last week’s low at 102.64 (February 9) should open the door to a deeper pullback in the short term to, initially, the 3-month support line, today near 102.35.

In the longer run, while below the 200-day SMA at 106.45, the outlook for the index remains negative.

DXY daily chart 

Dollar Index Spot

Overview
Today last price103.01
Today Daily Change35
Today Daily Change %-0.26
Today daily open103.28
 
Trends
Daily SMA20102.45
Daily SMA50103.42
Daily SMA100105.97
Daily SMA200106.73
 
Levels
Previous Daily High103.83
Previous Daily Low103.24
Previous Weekly High103.96
Previous Weekly Low102.64
Previous Monthly High105.63
Previous Monthly Low101.5
Daily Fibonacci 38.2%103.47
Daily Fibonacci 61.8%103.61
Daily Pivot Point S1103.06
Daily Pivot Point S2102.85
Daily Pivot Point S3102.47
Daily Pivot Point R1103.66
Daily Pivot Point R2104.05
Daily Pivot Point R3104.26

Author

Pablo Piovano

Born and bred in Argentina, Pablo has been carrying on with his passion for FX markets and trading since his first college years.

More from Pablo Piovano
Share:

Editor's Picks

EUR/USD looks sidelined around 1.1850

EUR/USD remains on the back foot, extending its bearish tone and sliding towards the 1.1850 area to print fresh daily lows on Monday. The move lower comes as the US Dollar gathers modest traction, with thin liquidity and subdued volatility amplifying price swings amid the US market holiday.

GBP/USD flirts with daily lows near 1.3630

GBP/USD has quickly given back Friday’s solid gains, turning lower at the start of the week and drifting back towards the 1.3630 area. The focus now shifts squarely to Tuesday’s UK labour market report, which is likely to keep the quid firmly in the spotlight and could set the tone for Cable’s next move.

Gold battle around $5,000 continues

Gold is giving back part of Friday’s sharp rebound, deflating below the key $5,000 mark per troy ounce as the new week gets underway. Modest gains in the US Dollar are keeping the metal in check, while thin trading conditions, due to the Presidents Day holiday in the US, are adding to the choppy and hesitant tone across markets.

Bitcoin consolidates as on-chain data show mixed signals

Bitcoin price has consolidated between $65,700 and $72,000 over the past nine days, with no clear directional bias. US-listed spot ETFs recorded a $359.91 million weekly outflow, marking the fourth consecutive week of withdrawals.

The week ahead: Key inflation readings and why the AI trade could be overdone

It is likely to be a quiet start to the week, with US markets closed on Monday for Presidents Day. European markets are higher across the board and gold is clinging to the $5,000 level after the tamer than expected CPI report in the US reduced haven flows to precious metals.

XRP steadies in narrow range as fund inflows, futures interest rise

Ripple is trading in a narrow range between $1.45 (immediate support) and $1.50 (resistance) at the time of writing on Monday. The remittance token extended its recovery last week, peaking at $1.67 on Sunday from the weekly open at $1.43.