|

USD/IDR Technical Analysis: Three-year-old rising trendline in focus

  • USD/IDR seesaws around 61.8% Fibonacci retracement of 2016/18 upside.
  • Bearish MACD, failure to carry the previous month’s recovery indicate further declines.

USD/IDR remains under pressure while trading around 13,870 during the pre-European session on Tuesday. The pair recently slipped beneath 61.8% Fibonacci retracement of longer-term upside and hence a monthly close will be closely observed for further direction.

On a monthly close below 61.8% Fibonacci retracement of 13,860, the pair could aim for the three-year-old ascending support line, at 13,600.

If at all bearish histogram of MACD drags the quote well below 13,600, May 2017 high near 13,490 will be in the spotlight.

Alternatively, bulls will refrain from entry unless breaking a 14-month long descending trend line, at 14,250 now.

However, a sustained break of 14,250 will propel prices to yearly top nearing 14,720.

USD/IDR monthly chart
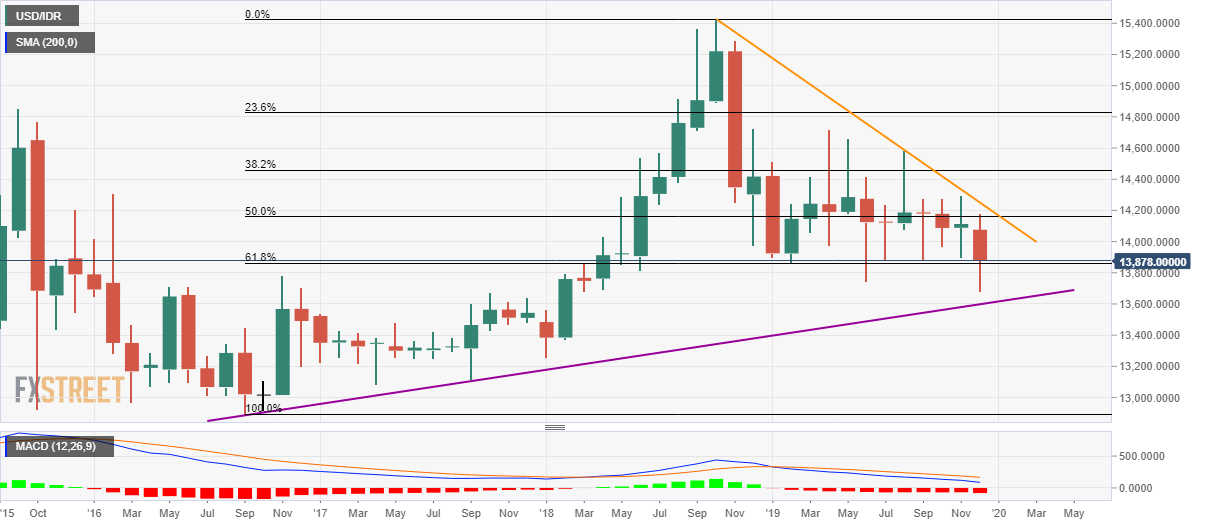
Trend: Bearish

Additional important levels

Overview
Today last price13883
Today Daily Change-34.5000
Today Daily Change %-0.25%
Today daily open13917.5
 
Trends
Daily SMA2013981.1711
Daily SMA5014031.7154
Daily SMA10014093.8172
Daily SMA20014146.1941
 
Levels
Previous Daily High13957.8
Previous Daily Low13877
Previous Weekly High14020.7355
Previous Weekly Low13676.9335
Previous Monthly High14296.292
Previous Monthly Low13896.3
Daily Fibonacci 38.2%13907.8656
Daily Fibonacci 61.8%13926.9344
Daily Pivot Point S113877.0667
Daily Pivot Point S213836.6333
Daily Pivot Point S313796.2667
Daily Pivot Point R113957.8667
Daily Pivot Point R213998.2333
Daily Pivot Point R314038.6667

Author

Anil Panchal

Anil Panchal

FXStreet

Anil Panchal has nearly 15 years of experience in tracking financial markets. With a keen interest in macroeconomics, Anil aptly tracks global news/updates and stays well-informed about the global financial moves and their implications.

More from Anil Panchal
Share:

Editor's Picks

EUR/USD off highs, back to 1.1850

EUR/USD loses some upside momentum, returning to the 1.1850 region amid humble losses. The pair’s slight decline comes against the backdrop of a marginal advance in the US Dollar as investors continue to assess the latest US CPI readings.

GBP/USD advances to daily tops around 1.3650

GBP/USD now manages to pick up extra pace, clinching daily highs around 1.3650 and leaving behind three consecutive daily pullbacks on Friday. Cable’s improved sentiment comes on the back of the inconclusive price action of the Greenback, while recent hawkish comments from the BoE’s Pill also collaborates with the uptick.

Gold surpasses $5,000/oz, daily highs

Gold is reclaiming part of the ground lost on Wednesday’s marked decline, as bargain-hunters keep piling up and lifting prices past the key $5,000 per troy ounce. The yellow metal’s upside is also propped up by the lack of clear direction around the US Dollar post-US CPI release.

Crypto Today: Bitcoin, Ethereum, XRP in choppy price action, weighed down by falling institutional interest 

Bitcoin's upside remains largely constrained amid weak technicals and declining institutional interest. Ethereum trades sideways above $1,900 support with the upside capped below $2,000 amid ETF outflows.

Week ahead – Data blitz, Fed Minutes and RBNZ decision in the spotlight

US GDP and PCE inflation are main highlights, plus the Fed minutes. UK and Japan have busy calendars too with focus on CPI. Flash PMIs for February will also be doing the rounds. RBNZ meets, is unlikely to follow RBA’s hawkish path.

Ripple Price Forecast: XRP potential bottom could be in sight

Ripple edges up above the intraday low of $1.35 at the time of writing on Friday amid mixed price actions across the crypto market. The remittance token failed to hold support at $1.40 the previous day, reflecting risk-off sentiment amid a decline in retail and institutional sentiment.