|

USD/IDR technical analysis: Immediate resistance-line questions upside momentum at 14,410

  • A month-old ascending channel portrays the pair’s strength.
  • Immediate downward sloping trend-line questions the upside momentum.

With a week-long descending trend-line challenging its near-term upside bias, the USD/IDR pair trades near 14,460 during early Tuesday.

The pair has been following an upward sloping trend-channel formation since late-April but its latest trading pattern gives rise to an immediate resistance-line on H4.

As a result, 14,520 can act as immediate resistance for the pair ahead of 14,580 and the channel’s upper-line of 14,640.

Should there be increased upside past-14,640, the quote can extend its north-run towards 14,665 and 14,720.

Meanwhile, a downside break of channel-support, at 14,410 now, can trigger fresh declines in the direction to 61.8% Fibonacci retracement of late-April upside, at 14,300.

Given the bears’ refrain from respecting 14,300 rest-point, 14,180 and 14,100 can offer intermediate stops to the downturn targeting 14,000 mark.

USD/IDR 4-Hour chart

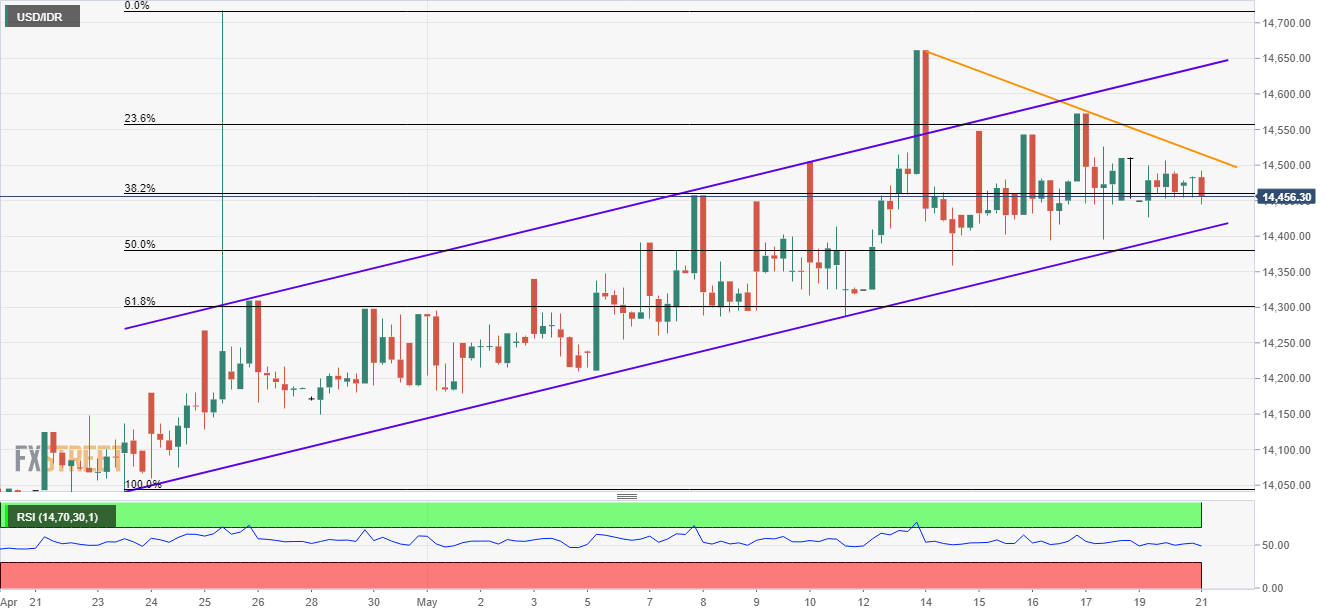
Trend: Pullback expected

    1. R3 14595.5
    2. R2 14551
    3. R1 14515
  1. PP 14470.5
    1. S1 14434.5
    2. S2 14390
    3. S3 14354

Author

Anil Panchal

Anil Panchal

FXStreet

Anil Panchal has nearly 15 years of experience in tracking financial markets. With a keen interest in macroeconomics, Anil aptly tracks global news/updates and stays well-informed about the global financial moves and their implications.

More from Anil Panchal
Share:

Editor's Picks

EUR/USD looks weak below 1.1800

EUR/USD has slipped back under pressure, breaking through the 1.1800 support and drifting towards the weekly lows near 1.1770 ahead of the opening bell in Asia. The move reflects renewed strength in the US Dollar, with steady geopolitical tensions keeping its demand firm. Moving forward, the release of the German labour market report and flash inflation figures should keep European investors entertained on Friday.
 

GBP/USD threatens the 200-day SMA near 1.3440

GBP/USD rapidly leaves behind Wednesday’s strong advance, coming under heavy pressure and retesting the 1.3440 zone, where the critical 200-day SMA is located. Cable’s deep pullback follows the strong gains in the Greenback, while investors continue to pencil in a potential BoE rate cut in March.

Gold trims gains, slips back to around $5,170

Gold is now facing some downside pressure, hovering around the $5,170 region on Thursday. The yellow metal surrenders part of its earlier gains on the back of the resurgence of the buying interest in the Greenback. In the meantime, geopolitical tensions in the Middle East continue to limit the downside potential for now.

How AI, blockchain, stablecoins are shaping a new global economy – Circle CEO Jeremy Allaire

Artificial Intelligence (AI), blockchain technology and stablecoins are emerging as core pillars of a new global economic system, according to Circle’s CEO, Jeremy Allaire.

Changing the game: International implications of recent tariff developments

The Supreme Court ruling on International Emergency Economic Powers Act (IEEPA) tariffs provides limited relief for the rest of the world, with weighted average tariff rates modestly lower.

Bitcoin steadies as traders eye US–Iran talks

Bitcoin (BTC) price is stabilizing around $68,000 at the time of writing on Thursday after a 6.2% relief rally the previous day amid a broader downward trend.