|

USD/IDR technical analysis: Bearish MACD questions pullback from 38.2% Fibo.

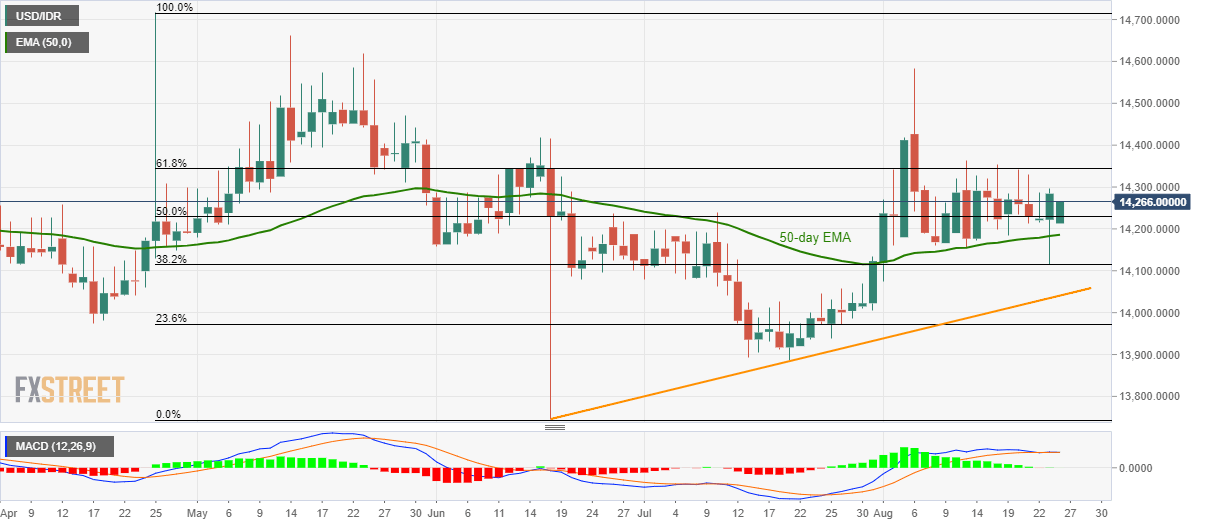
  • USD/IDR remains above 50-day EMA after bouncing off 38.2% Fibonacci retracement of April-June downpour.
  • Bearish MACD, repeated failures to rise past-61.8% Fibonacci retracement favor sellers.

Despite regaining its stand beyond 50-day exponential moving average (EMA), the USD/IDR pair remains on the back while making the rounds to 14,213 on early Monday.

The pair pulled back from 38.2% Fibonacci retracement but bearish signals by the 12-bar moving average convergence and divergence (MACD), coupled with repeated failures to cross 61.8% Fibonacci retracement, favor the odds of pair’s declines to 50-day EMA level near 14,180 and then to Friday’s low near 14,115.

In a case prices keep falling after 14,115, an upward sloping trend-line since June 18, at 14,040 can offer an intermediate halt to prices ahead of highlighting 14,000 round-figure.

Meanwhile, a daily closing beyond 61.8% Fibonacci retracement level of 14,344 can push buyers towards June 17 high close to 14,420.

During the pair’s run-up past-14,420, current month top around 14,580 will be the key to watch for bulls.

USD/IDR daily chart

Trend: Sideways

    1. R3 14527.35 
    2. R2 14411.45 
    3. R1 14347.75
  1. PP  14231.85
    1. S1  14168.15
    2. S2  14052.25
    3. S3  13988.55

Author

Anil Panchal

Anil Panchal

FXStreet

Anil Panchal has nearly 15 years of experience in tracking financial markets. With a keen interest in macroeconomics, Anil aptly tracks global news/updates and stays well-informed about the global financial moves and their implications.

More from Anil Panchal
Share:

Editor's Picks

EUR/USD extends its optimism past 1.1900

EUR/USD retains a firm underlying bid, surpassing the 1.1900 mark as the NA session draws to a close on Monday. The pair’s persistent uptrend comes as the US Dollar remains on the defensive, with traders staying cautious ahead of upcoming US NFP prints and CPI data.
 

GBP/USD tilts bullish as markets barrel toward mid-week NFP print

GBP/USD is holding a broader bullish structure on the daily chart, with price trading well above the 50 Exponential Moving Average at 1.3507 and the 200 EMA at 1.3310, confirming the intermediate uptrend that has been in place since the November 2025 low near 1.2300. 

Gold pushes back above $5,000

The daily chart shows spot Gold in a parabolic uptrend that accelerated sharply from the $4,600 area in late January, printing a record high at $5,598.25 before a violent reversal erased nearly $1,000 in value during the final days of the month. 

Litecoin eyes $50 as heavy losses weigh on investors

Following a strong downtrend across the crypto market over the past week, Litecoin holders are under immense pressure. The Bitcoin fork has trimmed about $1.81 billion from its market capitalization since the beginning of the year, sending it below the top 20 cryptos by market cap.

Japanese PM Takaichi nabs unprecedented victory – US data eyed this week

I do not think I would be exaggerating to say that Japanese Prime Minister Sanae Takaichi’s snap general election gamble paid off over the weekend – and then some. This secured the Liberal Democratic Party (LDP) an unprecedented mandate just three months into her tenure.

Ripple exposed to volatility amid low retail interest, modest fund inflows

Ripple (XRP) is extending its intraday decline to around $1.40 at the time of writing on Monday amid growing pressure from the retail market and risk-off sentiment that continues to keep investors on the sidelines.