|

USD/IDR technical analysis: 14,120 holds the key to a month-old rising trendline

  • USD/IDR nears 200-bar SMA, 38.2% Fibonacci retracement confluence.
  • An upward sloping trend-line since September 20 adds to the supports.
  • The last week’s top acts as immediate resistance to watch.

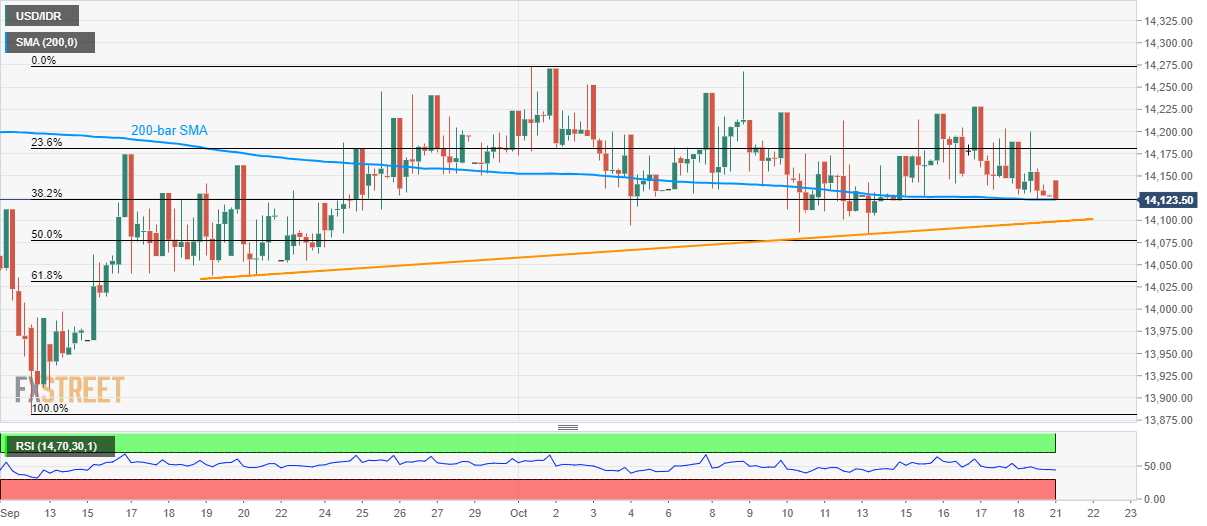
Although gradual weakness from last week’s top drags the USD/IDR pair to a week’s bottom, the quote stays above near-term key support confluence while trading around 14,125 during early Monday.

38.2% Fibonacci retracement of mid-September to early October run-up joins 200-bar Simple Moving Average (SMA) while offering the key support confluence near 14,120. Should sellers dominate below that, a four-week-old rising trend-line, at 14,100, will be important to watch.

In a case where prices keep declining below 14,100, 61.8% Fibonacci retracement level of 14,030 and 14,000 will flash on bears’ radar.

Alternatively, pair’s rise above last week’s high nearing 14,230 can escalate the recovery towards 14,270/75 area that includes the monthly top.

USD/IDR 4-hour chart

Trend: sideways

additional important levels

Overview
Today last price14129
Today Daily Change1.5000
Today Daily Change %0.01%
Today daily open14127.5
 
Trends
Daily SMA2014157.7925
Daily SMA5014160.33
Daily SMA10014149.605
Daily SMA20014167.6498
 
Levels
Previous Daily High14199.5
Previous Daily Low14123
Previous Weekly High14228
Previous Weekly Low14085
Previous Monthly High14276.5
Previous Monthly Low13883
Daily Fibonacci 38.2%14152.223
Daily Fibonacci 61.8%14170.277
Daily Pivot Point S114100.5
Daily Pivot Point S214073.5
Daily Pivot Point S314024
Daily Pivot Point R114177
Daily Pivot Point R214226.5
Daily Pivot Point R314253.5

Author

Anil Panchal

Anil Panchal

FXStreet

Anil Panchal has nearly 15 years of experience in tracking financial markets. With a keen interest in macroeconomics, Anil aptly tracks global news/updates and stays well-informed about the global financial moves and their implications.

More from Anil Panchal
Share:

Editor's Picks

EUR/USD flirts with weekly lows near 1.1770

EUR/USD now comes under further selling pressure, breaking below the 1.1800 support to challenge the area of weekly throughs near 1.1770 on Thursday. The pair’s decline comes in response to marked gains in the US Dollar amid steady geopolitical tensions. Ealier in the day, the ECB’s Lagarde delivered cautious remarks, although the currency remained apathetic.

GBP/USD threatens the 200-day SMA near 1.3440

GBP/USD rapidly leaves behind Wednesday’s strong advance, coming under heavy pressure and retesting the 1.3440 zone, where the critical 200-day SMA is located. Cable’s deep pullback follows the strong gains in the Greenback, while investors continue to pencil in a potential BoE rate cut in March.

Gold trims gains, slips back to around $5,170

Gold is now facing some downside pressure, hovering around the $5,170 region on Thursday. The yellow metal surrenders part of its earlier gains on the back of the resurgence of the buying interest in the Greenback. In the meantime, geopolitical tensions in the Middle East continue to limit the downside potential for now.

Stellar: Relief bounce fades as bearish undertone persists

Stellar is trading around $0.16 at the time of writing on Thursday after rebounding more than 8% in the previous day. Derivatives data paints a negative picture as XLM’s short bets hit a monthly high while Open Interest continues to decline.

Changing the game: International implications of recent tariff developments

The Supreme Court ruling on International Emergency Economic Powers Act (IEEPA) tariffs provides limited relief for the rest of the world, with weighted average tariff rates modestly lower.

Bitcoin steadies as traders eye US–Iran talks

Bitcoin (BTC) price is stabilizing around $68,000 at the time of writing on Thursday after a 6.2% relief rally the previous day amid a broader downward trend.