USD/CNH Price Analysis: Stays on the way to 50-DMA despite upbeat China PMI


  • USD/CNH recovers from intraday low, stays positive for second consecutive day.
  • China’s official PMI data arrived better than expected in December.
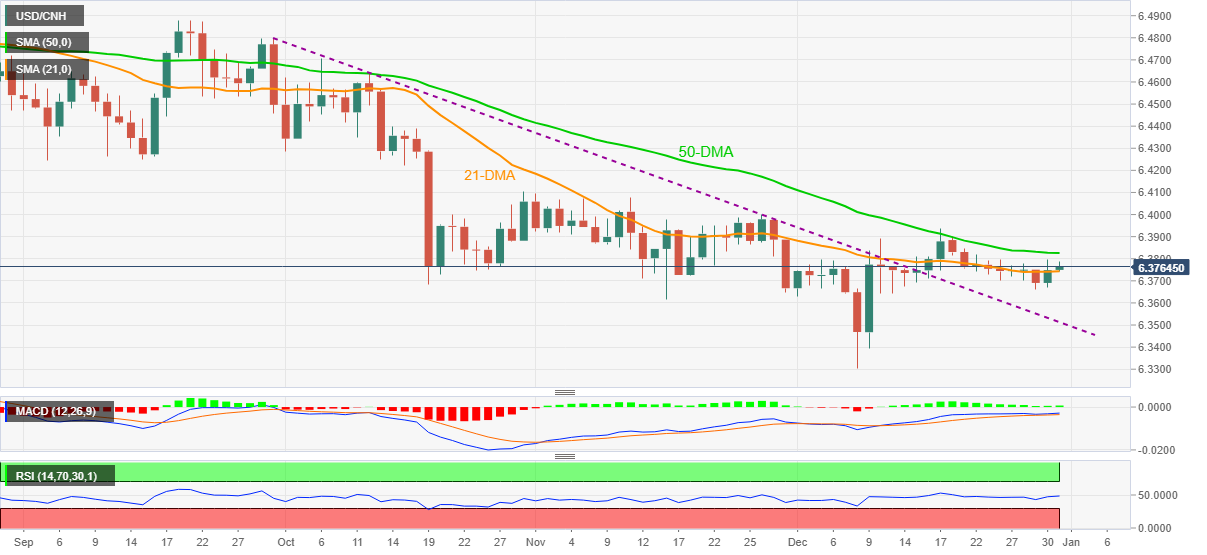
  • Sustained break of 21-DMA, firmer oscillators favor bulls.
  • The previous resistance line from September becomes critical support.

USD/CNH picks up bids to extend the previous day’s rebound, bouncing off intraday low to $6.3775 during early Friday in Asia.

In doing so, the offshore Chinese currency (CNH) pair fails to cheer upbeat official PMI data for December. That said, China’s NBS Manufacturing Purchasing Managers' Index (PMI) grew past the 50.1 forecast and prior release to 50.3 while the Non-Manufacturing PMI rose to 52.7 versus 52.3 previous readouts but eased below 53.1 market consensus.

Technically, the pair’s sustained bounce off 21-DMA joins firmer RSI and bullish MACD signals to direct USD/CNH buyers towards the 50-DMA, around $6.3825 at the latest.

However, the monthly top around $6.3940 and the $6.4000 threshold will challenge the pair’s further upside.

Meanwhile, pullback moves remain elusive until staying beyond the 21-DMA level of $6.3743, a break of which will direct the quote towards the weekly low of $6.3660.

It should be noted, though, that a three-month-old resistance-turned-support line near $6.3500, becomes crucial support to watch for the USD/CNH traders.

USD/CNH: Daily chart

Trend: Further upside expected

Additional important levels

Overview
Today last price 6.377
Today Daily Change 0.0022
Today Daily Change % 0.03%
Today daily open 6.3748
 
Trends
Daily SMA20 6.3742
Daily SMA50 6.3828
Daily SMA100 6.4189
Daily SMA200 6.4439
 
Levels
Previous Daily High 6.3794
Previous Daily Low 6.367
Previous Weekly High 6.3902
Previous Weekly Low 6.37
Previous Monthly High 6.4094
Previous Monthly Low 6.3616
Daily Fibonacci 38.2% 6.3747
Daily Fibonacci 61.8% 6.3717
Daily Pivot Point S1 6.3681
Daily Pivot Point S2 6.3613
Daily Pivot Point S3 6.3556
Daily Pivot Point R1 6.3806
Daily Pivot Point R2 6.3863
Daily Pivot Point R3 6.3931


Share: Feed news

Information on these pages contains forward-looking statements that involve risks and uncertainties. Markets and instruments profiled on this page are for informational purposes only and should not in any way come across as a recommendation to buy or sell in these assets. You should do your own thorough research before making any investment decisions. FXStreet does not in any way guarantee that this information is free from mistakes, errors, or material misstatements. It also does not guarantee that this information is of a timely nature. Investing in Open Markets involves a great deal of risk, including the loss of all or a portion of your investment, as well as emotional distress. All risks, losses and costs associated with investing, including total loss of principal, are your responsibility. The views and opinions expressed in this article are those of the authors and do not necessarily reflect the official policy or position of FXStreet nor its advertisers. The author will not be held responsible for information that is found at the end of links posted on this page.

If not otherwise explicitly mentioned in the body of the article, at the time of writing, the author has no position in any stock mentioned in this article and no business relationship with any company mentioned. The author has not received compensation for writing this article, other than from FXStreet.

FXStreet and the author do not provide personalized recommendations. The author makes no representations as to the accuracy, completeness, or suitability of this information. FXStreet and the author will not be liable for any errors, omissions or any losses, injuries or damages arising from this information and its display or use. Errors and omissions excepted.

The author and FXStreet are not registered investment advisors and nothing in this article is intended to be investment advice.

Recommended content


Recommended content

Editors’ Picks

EUR/USD drops to near 1.0850, further support at nine-day EMA

EUR/USD drops to near 1.0850, further support at nine-day EMA

EUR/USD continues to lose ground, trading around 1.0860 during the Asian hours on Friday. From a technical perspective on a daily chart analysis indicates a sideways trend for the pair as it continues to lie within the symmetrical triangle.

EUR/USD News

GBP/USD posts modest gains above 1.2650, focus on the Fedspeak

GBP/USD posts modest gains above 1.2650, focus on the Fedspeak

The GBP/USD pair posts modest gains near 1.2670 during the Asian session on Friday. Meanwhile, the USD Index recovers some lost ground after retracing to multi-week lows near 104.00 in the previous session.

GBP/USD News

Gold price gains ground, with Fed speakers in focus

Gold price gains ground, with Fed speakers in focus

The Gold price trades with a positive bias on Friday. The bullish move of precious metals in the previous sessions was bolstered by the softer-than-expected US inflation data in April, which triggered hope for rate cuts from the US Fed. 

Gold News

LINK price jumps 10% as Chainlink races toward tokenization of funds

LINK price jumps 10% as Chainlink races toward tokenization of funds

Chainlink price has remained range-bound for a while, stuck between the $16.00 roadblock to the upside and $13.08 to the downside. However, in light of recent revelations, the token may have further upside potential.

Read more

Fed speak tempers rate cut expectations

Fed speak tempers rate cut expectations

The biggest takeaway into Friday is the latest round of Fed speak. These Fed officials reiterated their stance rates should be kept restrictive for a longer period of time until there is more clear evidence inflation is heading back towards the 2% target.  

Read more

Forex MAJORS

Cryptocurrencies

Signatures