USD/CNH Price Analysis: Further downside towards sub-6.9000 zone appears compelling


  • USD/CNH remains pressured at three-month low, down for the sixth consecutive day.
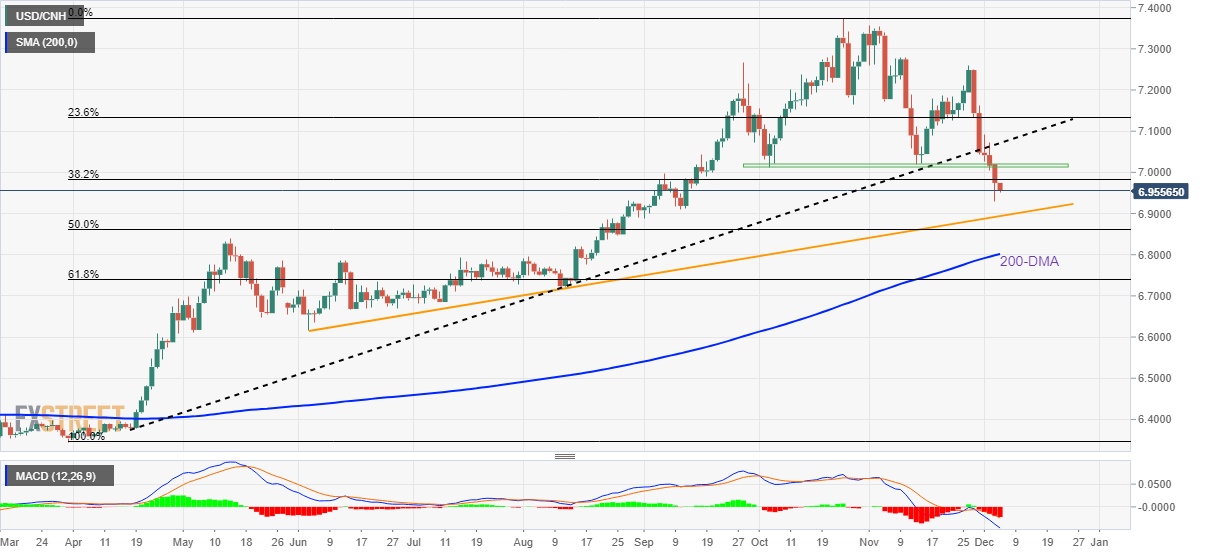
  • Clear break of multi-day-old support line, bearish MACD signals favor sellers.
  • Lows marked in October, November guard immediate upside.

USD/CNH bears keep the reins during early Tuesday, printing a six-day south-run around 6.9570 by the press time. In doing so, the offshore Chinese Yuan (CNH) pair justifies the previous week’s downside break of an ascending trend line from April.

Given bearish MACD signals favoring the USD/CNH pair’s trend line break, the sellers are well-set to challenge the monthly low marked the previous day around 6.9300.

Following that, September 10 swing low near 6.9100 may act as an intermediate halt during the likely fall towards a six-month-old ascending support line, close to 6.8940 at the latest.

In a case where USD/CNH remains bearish past 6.8940, the 50% Fibonacci retracement level of the pair’s run-up from late March to October, around 6.8600, will precede the 200-DMA support near 6.8015 to challenge the further downside.

Alternatively, recovery remains elusive unless the quote stays below the support-turned-resistance line stretched from April, near 7.0700 by the press time.

That said, an area comprising lows marked during November and October, around 7.0130-200, restricts the pair’s immediate upside.

It’s worth noting that multiple hurdles surrounding 7.2600-2700 could question the USD/CNH bulls before giving them control.

USD/CNH: Daily chart

Trend: Further downside expected

Additional important levels

Overview
Today last price 6.9558
Today Daily Change -0.0184
Today Daily Change % -0.26%
Today daily open 6.9742
 
Trends
Daily SMA20 7.1262
Daily SMA50 7.1741
Daily SMA100 7.0219
Daily SMA200 6.7985
 
Levels
Previous Daily High 7.0198
Previous Daily Low 6.9298
Previous Weekly High 7.2598
Previous Weekly Low 7.005
Previous Monthly High 7.3568
Previous Monthly Low 7.0194
Daily Fibonacci 38.2% 6.9642
Daily Fibonacci 61.8% 6.9855
Daily Pivot Point S1 6.9294
Daily Pivot Point S2 6.8846
Daily Pivot Point S3 6.8394
Daily Pivot Point R1 7.0194
Daily Pivot Point R2 7.0646
Daily Pivot Point R3 7.1094


Share: Feed news

Information on these pages contains forward-looking statements that involve risks and uncertainties. Markets and instruments profiled on this page are for informational purposes only and should not in any way come across as a recommendation to buy or sell in these assets. You should do your own thorough research before making any investment decisions. FXStreet does not in any way guarantee that this information is free from mistakes, errors, or material misstatements. It also does not guarantee that this information is of a timely nature. Investing in Open Markets involves a great deal of risk, including the loss of all or a portion of your investment, as well as emotional distress. All risks, losses and costs associated with investing, including total loss of principal, are your responsibility. The views and opinions expressed in this article are those of the authors and do not necessarily reflect the official policy or position of FXStreet nor its advertisers. The author will not be held responsible for information that is found at the end of links posted on this page.

If not otherwise explicitly mentioned in the body of the article, at the time of writing, the author has no position in any stock mentioned in this article and no business relationship with any company mentioned. The author has not received compensation for writing this article, other than from FXStreet.

FXStreet and the author do not provide personalized recommendations. The author makes no representations as to the accuracy, completeness, or suitability of this information. FXStreet and the author will not be liable for any errors, omissions or any losses, injuries or damages arising from this information and its display or use. Errors and omissions excepted.

The author and FXStreet are not registered investment advisors and nothing in this article is intended to be investment advice.

Recommended content


Recommended content

Editors’ Picks

AUD/USD remained bid above 0.6500

AUD/USD remained bid above 0.6500

AUD/USD extended further its bullish performance, advancing for the fourth session in a row on Thursday, although a sustainable breakout of the key 200-day SMA at 0.6526 still remain elusive.

AUD/USD News

EUR/USD faces a minor resistance near at 1.0750

EUR/USD faces a minor resistance near at 1.0750

EUR/USD quickly left behind Wednesday’s small downtick and resumed its uptrend north of 1.0700 the figure, always on the back of the persistent sell-off in the US Dollar ahead of key PCE data on Friday.

EUR/USD News

Gold holds around $2,330 after dismal US data

Gold holds around $2,330 after dismal US data

Gold fell below $2,320 in the early American session as US yields shot higher after the data showed a significant increase in the US GDP price deflator in Q1. With safe-haven flows dominating the markets, however, XAU/USD reversed its direction and rose above $2,340.

Gold News

Bitcoin price continues to get rejected from $65K resistance as SEC delays decision on spot BTC ETF options

Bitcoin price continues to get rejected from $65K resistance as SEC delays decision on spot BTC ETF options

Bitcoin (BTC) price has markets in disarray, provoking a broader market crash as it slumped to the $62,000 range on Thursday. Meanwhile, reverberations from spot BTC exchange-traded funds (ETFs) continue to influence the market.

Read more

US economy: slower growth with stronger inflation

US economy: slower growth with stronger inflation

The dollar strengthened, and stocks fell after statistical data from the US. The focus was on the preliminary estimate of GDP for the first quarter. Annualised quarterly growth came in at just 1.6%, down from the 2.5% and 3.4% previously forecast.

Read more

Forex MAJORS

Cryptocurrencies

Signatures