|

USD/CNH Price Analysis: Fades bounces off weekly support below 7.2000

  • USD/CNH struggles to defend the recovery moves, retreats from intraday high.
  • Steady RSI suggests further grinding towards the north.
  • 12-day-old ascending trend line, 50-SMA adds to the downside filters.
  • Bullish bias remains intact beyond 7.1000, buyers aim for a fresh all-time high.

USD/CNH reverses the previous day’s pullback from the record high during early Thursday morning in Europe, despite recent inaction around 7.1880.

In doing so, the offshore Chinese yuan (CNH) pair bounces off a horizontal area comprising multiple lows marked since Monday amid a steady RSI (14). However, bearish MACD signals and the buyer’s inability to keep the reins beyond the 7.2000 psychological magnet challenge the pair’s upside momentum.

It should be noted, however, that the pair’s pullback moves below the aforementioned immediate support near 7.1460-50 are likely to be challenged by an upward sloping support line from September 13, close to 7.1280 by the press time.

Also acting as a downside filter is the 50-SMA level surrounding 7.1125.

Even if the quote drops below 7.1125, the September 22 swing high near 7.1060 and the 7.1000 psychological magnet could act as the last defenses for the USD/CNH buyers.

Alternatively, recovery moves need to stay beyond the 1.2000 mark to convince buyers to aim for the multiple hurdles near 1.2500.

Following that, the recently flashed record high near 7.2600 and the 7.3000 psychological magnet will be in focus.

USD/CNH: Four-hour chart
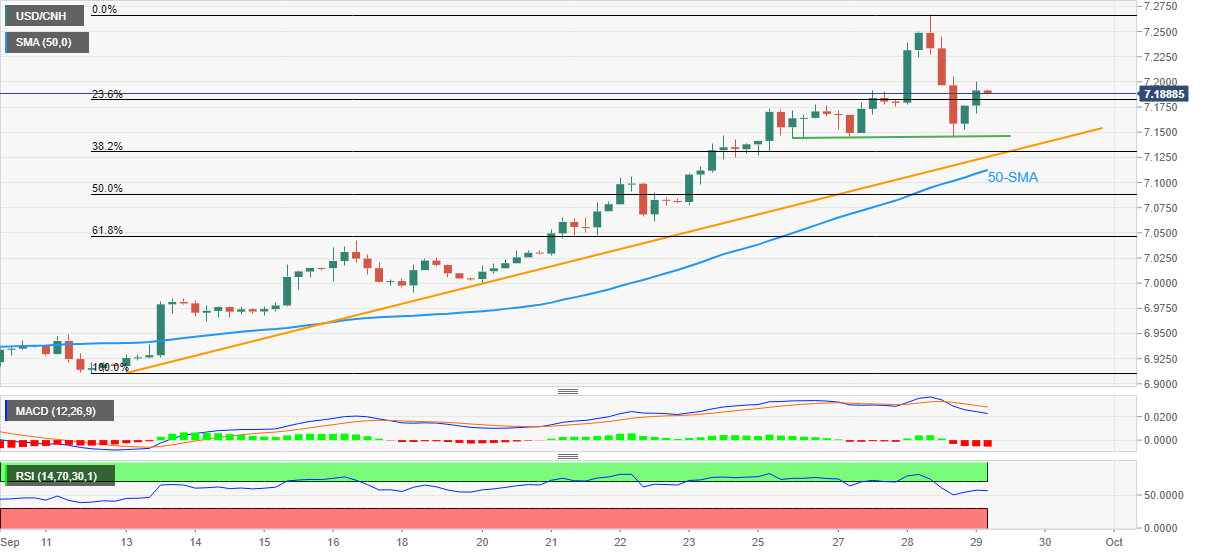
Trend: Bullish

Additional important levels

Overview
Today last price7.1886
Today Daily Change0.0272
Today Daily Change %0.38%
Today daily open7.1614
 
Trends
Daily SMA207.0168
Daily SMA506.886
Daily SMA1006.8009
Daily SMA2006.602
 
Levels
Previous Daily High7.2674
Previous Daily Low7.1444
Previous Weekly High7.1472
Previous Weekly Low6.9904
Previous Monthly High6.9326
Previous Monthly Low6.7164
Daily Fibonacci 38.2%7.1914
Daily Fibonacci 61.8%7.2205
Daily Pivot Point S17.1148
Daily Pivot Point S27.0681
Daily Pivot Point S36.9918
Daily Pivot Point R17.2378
Daily Pivot Point R27.3141
Daily Pivot Point R37.3608

Author

Anil Panchal

Anil Panchal

FXStreet

Anil Panchal has nearly 15 years of experience in tracking financial markets. With a keen interest in macroeconomics, Anil aptly tracks global news/updates and stays well-informed about the global financial moves and their implications.

More from Anil Panchal
Share:

Editor's Picks

EUR/USD risks a deeper drop below 1.1750

EUR/USD keeps its vacillating mood in place as the the NA session drwas to a close on Tuesday, hovering below the 1.1800 hurdle amid acceptable gains in the US Dollar. In the meantime, market participants and the FX galaxy are expected to closely follow President Trump’s SOTU speech around 2AM GMT.
 

GBP/USD regains 1.3500 and above

GBP/USD extends its advance for the third day in a row on Tuesday, this time retesting the area beyond the 1.3500 hurdle. Cable’s uptick comes despite decent gains in the Greenback and the dovish message from the BoE’s Bailey at the UK Parliament.

Gold appears offered around $5,150

Gold is giving back a good portion of the recent multi-day rally, receding to the $5,150 zone per troy ounce amid the decent bounce in the US Dollar and mixed US Treasuty yields. In the meantime, markets’ attention remain on upcoming comments from Fed speakers.

Australia CPI to highlight persistent price pressures, backing a hawkish outlook

Australia will release its key set of inflation figures for the month of January on Wednesday, with the Consumer Price Index expected to rise by 3.7%, slightly lower than the 3.8% in the last month of 2025.

The Citrini report: How a debatable AI narrative can shake Wall Street

That AI-related headline alone was enough to rattle investors.US stocks slid sharply on Monday after a widely circulated Citrini Research memo outlined a hypothetical “2028 Global Intelligence Crisis”, warning that rapid AI adoption could push US unemployment into double digits as early as by mid-2028.

XRP pressured by weak ETF flows and declining retail interest

Ripple (XRP) is edging lower, trading above its intraday low of $1.32 at the time of writing on Tuesday. The decline from its weekly opening of $1.39 reflects heightened volatility in the broader cryptocurrency market, accentuated by tariff-triggered uncertainty.