|

USD/CHF technical analysis: Positive above 200-bar SMA, 0.9890/87 confluence

  • USD/CHF pulls back from 0.9990, 23.6% Fibonacci retracement on the sellers’ radar.
  • 200-bar SMA, followed by rising multi-week-old rising trendline and 38.2% Fibonacci retracement, limit further declines.

Despite witnessing a downside pressure off-late, the USD/CHF pair remains well above the key supports while taking rounds to 0.9960 amid pre-European open session on Monday.

While 23.6% Fibonacci retracement of August–October upside, at 0.9940, seems to please short-term sellers, 200-bar Simple Moving Average (SMA) around 0.9920, will challenge bears afterward.

If at all prices decline below 0.9920, 0.9890/87 area including an upward sloping trend-line since September 04 and 38.2% Fibonacci retracement will limit further downside, if not then 0.9840 and 0.9800, comprising 61.8% Fibonacci retracement, could gain market attention.

On the contrary, pair’s run-up beyond 0.9990 can again aim for 1.0030 while May-end tops nearing 1.0100 could lure bulls then after.

USD/CHF 4-hour chart

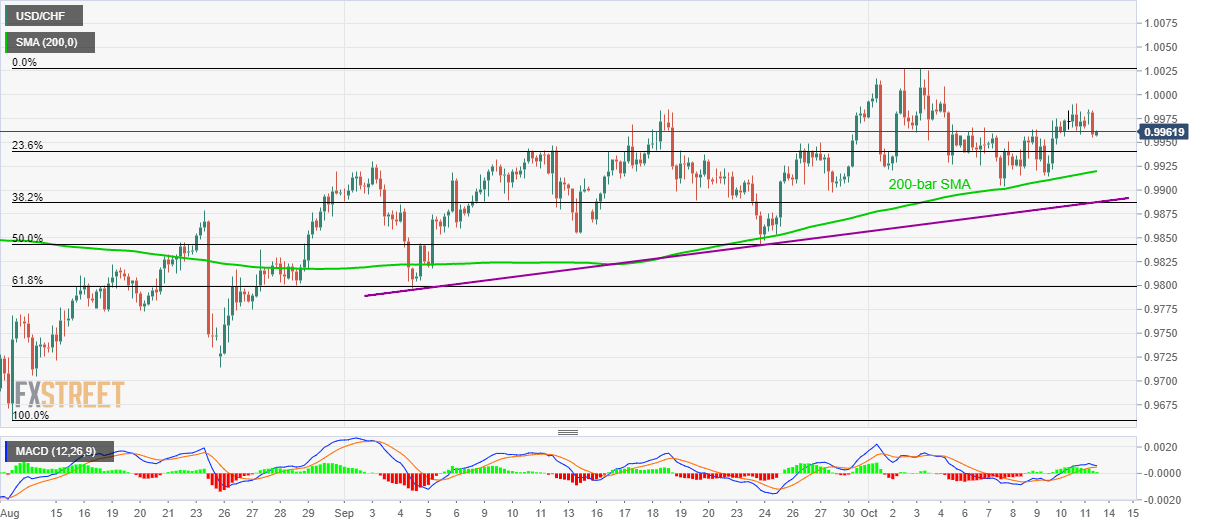
Trend: pullback expected

additional important levels

Overview
Today last price0.996
Today Daily Change-7 pips
Today Daily Change %-0.07%
Today daily open0.9967
 
Trends
Daily SMA200.9939
Daily SMA500.9867
Daily SMA1000.9881
Daily SMA2000.9953
 
Levels
Previous Daily High0.9991
Previous Daily Low0.9956
Previous Weekly High0.9991
Previous Weekly Low0.9904
Previous Monthly High0.9988
Previous Monthly Low0.9797
Daily Fibonacci 38.2%0.997
Daily Fibonacci 61.8%0.9978
Daily Pivot Point S10.9952
Daily Pivot Point S20.9937
Daily Pivot Point S30.9917
Daily Pivot Point R10.9987
Daily Pivot Point R21.0006
Daily Pivot Point R31.0021

Author

Anil Panchal

Anil Panchal

FXStreet

Anil Panchal has nearly 15 years of experience in tracking financial markets. With a keen interest in macroeconomics, Anil aptly tracks global news/updates and stays well-informed about the global financial moves and their implications.

More from Anil Panchal
Share:

Editor's Picks

EUR/USD looks sidelined around 1.1850

EUR/USD remains on the back foot, extending its bearish tone and sliding towards the 1.1850 area to print fresh daily lows on Monday. The move lower comes as the US Dollar gathers modest traction, with thin liquidity and subdued volatility amplifying price swings amid the US market holiday.

GBP/USD flirts with daily lows near 1.3630

GBP/USD has quickly given back Friday’s solid gains, turning lower at the start of the week and drifting back towards the 1.3630 area. The focus now shifts squarely to Tuesday’s UK labour market report, which is likely to keep the quid firmly in the spotlight and could set the tone for Cable’s next move.

Gold battle around $5,000 continues

Gold is giving back part of Friday’s sharp rebound, deflating below the key $5,000 mark per troy ounce as the new week gets underway. Modest gains in the US Dollar are keeping the metal in check, while thin trading conditions, due to the Presidents Day holiday in the US, are adding to the choppy and hesitant tone across markets.

Bitcoin consolidates as on-chain data show mixed signals

Bitcoin price has consolidated between $65,700 and $72,000 over the past nine days, with no clear directional bias. US-listed spot ETFs recorded a $359.91 million weekly outflow, marking the fourth consecutive week of withdrawals.

The week ahead: Key inflation readings and why the AI trade could be overdone

It is likely to be a quiet start to the week, with US markets closed on Monday for Presidents Day. European markets are higher across the board and gold is clinging to the $5,000 level after the tamer than expected CPI report in the US reduced haven flows to precious metals.

XRP steadies in narrow range as fund inflows, futures interest rise

Ripple is trading in a narrow range between $1.45 (immediate support) and $1.50 (resistance) at the time of writing on Monday. The remittance token extended its recovery last week, peaking at $1.67 on Sunday from the weekly open at $1.43.