USD/CHF Technical Analysis: Greenback bulls en route to the parity level against CHF

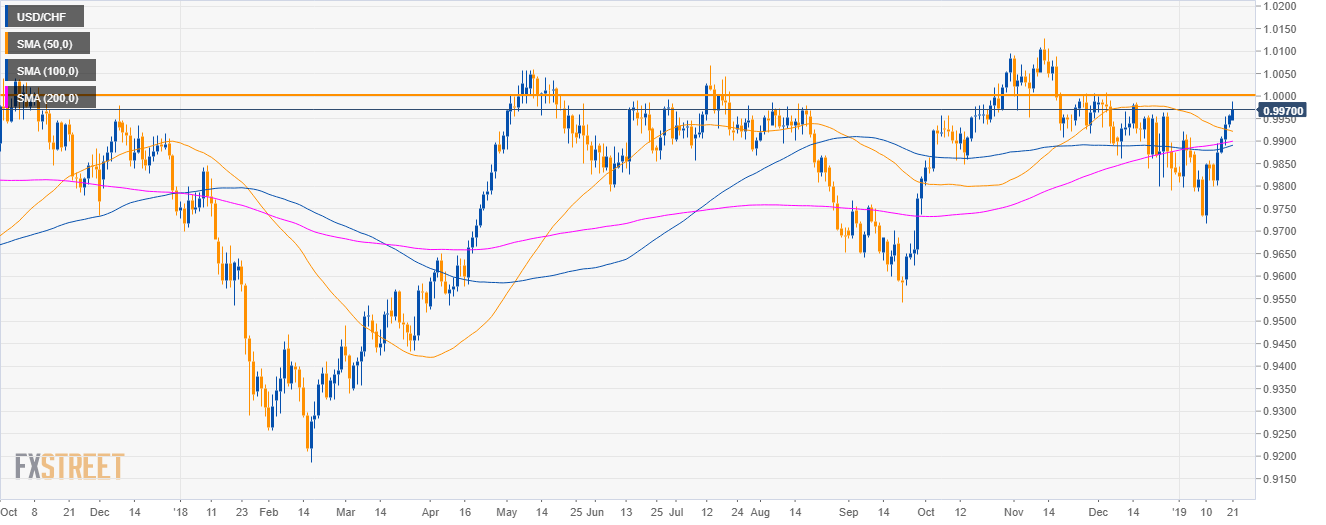
USD/CHF daily chart
- USD/CHF is trading in a sideways trend below the 50-day simple moving average (SMA).
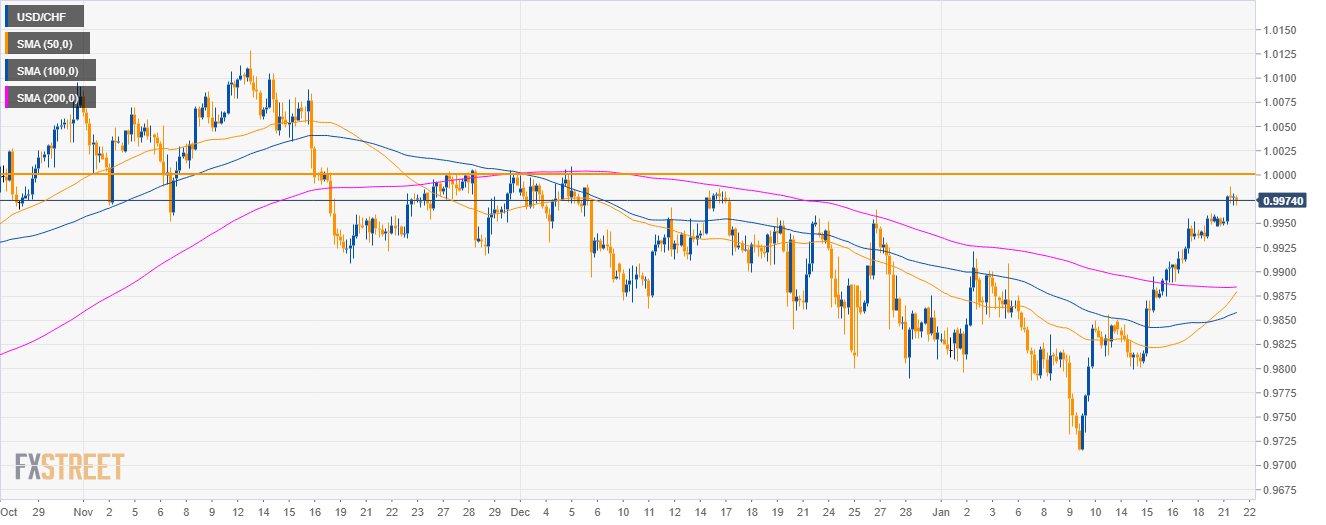
USD/CHF 4-hour chart
- USD/CHF is trading above the 50, 100 and 200 SMAs suggesting bullish momentum.
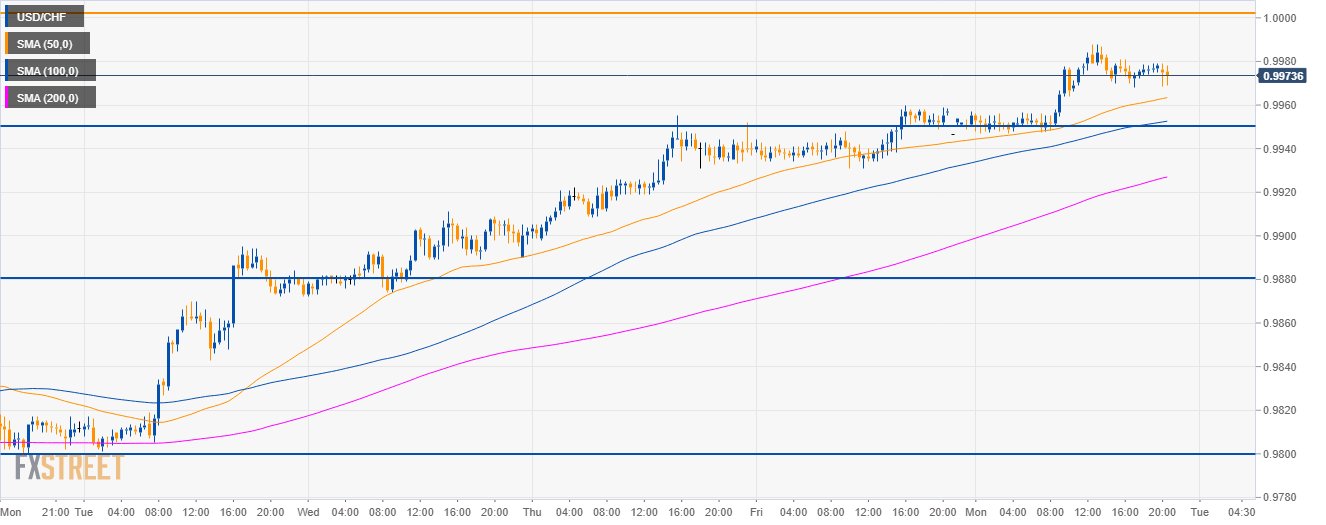
USD/CHF 30-minute chart
- USD/CHF is trading above its main SMAs suggesting that the market has room to move up to the parity level (1.0000).
- To the downside, support is seen near the 0.9950 and 0.9980 levels.
Additional key levels
USD/CHF
Overview:
Today Last Price: 0.9974
Today Daily change: 0.0017 pips
Today Daily change %: 0.17%
Today Daily Open: 0.9957
Trends:
Daily SMA20: 0.9861
Daily SMA50: 0.9924
Daily SMA100: 0.9888
Daily SMA200: 0.9896
Levels:
Previous Daily High: 0.996
Previous Daily Low: 0.9931
Previous Weekly High: 0.996
Previous Weekly Low: 0.9799
Previous Monthly High: 1.0009
Previous Monthly Low: 0.979
Daily Fibonacci 38.2%: 0.9949
Daily Fibonacci 61.8%: 0.9942
Daily Pivot Point S1: 0.9939
Daily Pivot Point S2: 0.992
Daily Pivot Point S3: 0.991
Daily Pivot Point R1: 0.9968
Daily Pivot Point R2: 0.9978
Daily Pivot Point R3: 0.9997
Author

Flavio Tosti
Independent Analyst


