USD/CHF Technical Analysis: 61.8% Fibonacci retracement on seller’s radar
- USD/CHF declines from the highest level in nearly six weeks.
- 61.8% of Fibonacci retracement acts as immediate support.
- Monthly trend line resistance limits nearby upside.

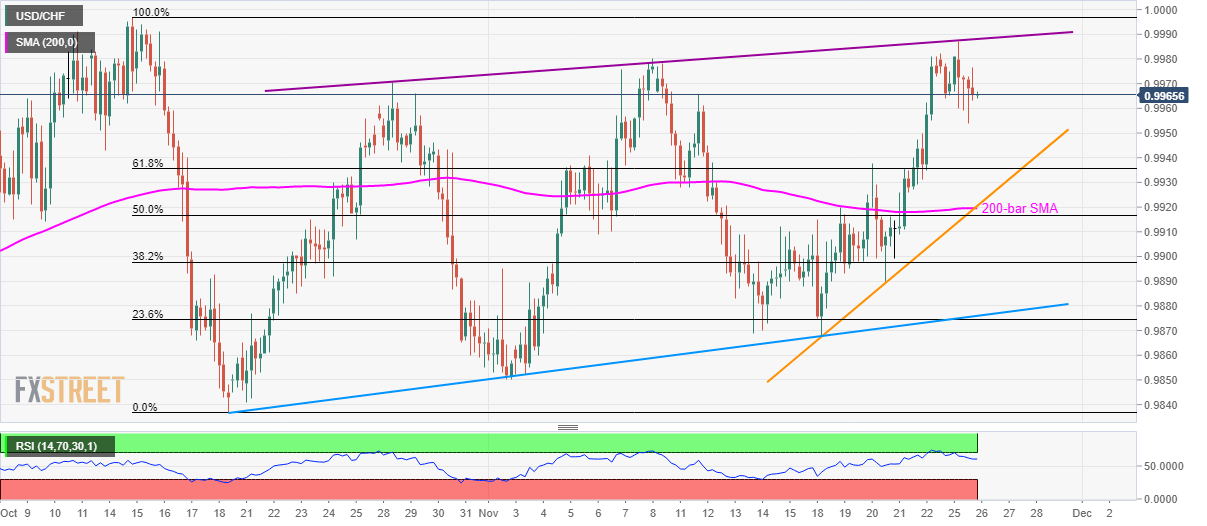
USD/CHF takes U-turn from a one-month-old resistance line while trading around 0.9965 amid the initial trading session on Tuesday.
Given the gradual pullback in the 14-bar Relative Strength Index (RSI) from the overbought conditions, prices might witness additional downside. In doing so, 61.8% Fibonacci retracement of October month fall, at 0.9935, acts as immediate support.
However, 200-bar Simple Moving Average (SMA) and one-week-old rising trend line, around 0.9920, will challenge bears afterward.
On the upside, the pair’s successful rise past-0.9990 resistance line needs to conquer 1.0000 psychological magnet to lure buyers towards the previous month high near 1.0030.
USD/CHF 4-hour chart
Trend: Pullback expected
Author

Anil Panchal
FXStreet
Anil Panchal has nearly 15 years of experience in tracking financial markets. With a keen interest in macroeconomics, Anil aptly tracks global news/updates and stays well-informed about the global financial moves and their implications.


