|

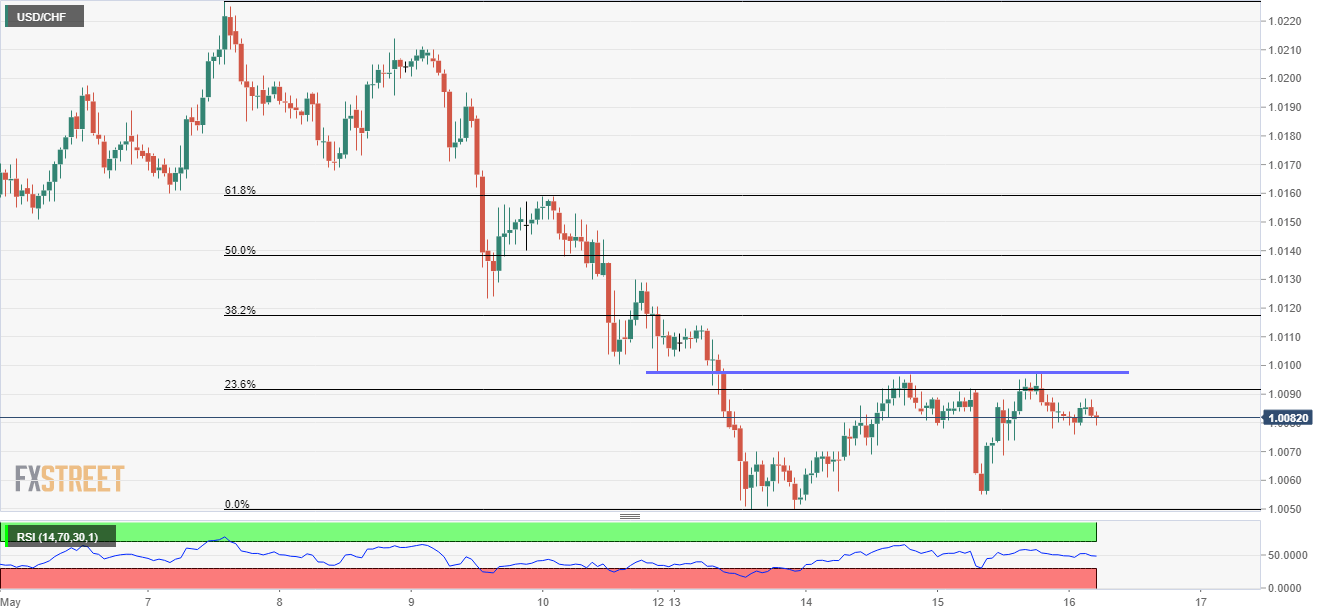
USD/CHF technical analysis: 1.0095/1.0100 acts as immediate upside barrier

  • The latest failure to clear 1.0095-1.0100 highlights the pair’s weakness.
  • 1.0050 seems strong downside support.

Even after bouncing off 1.0055, the USD/CHF pair currently trades near 1.0085 while heading into Europe open on Thursday.

The quote has been finding it difficult to cross 1.0095 – 1.0100 horizontal resistance since the week-start, making it an important upside barrier, a break of which can propel prices to 1.0130 and then to 61.8% Fibonacci retracement of latest downturn, at 1.0160.

Given the buyers’ dominance above 1.0160, 1.0210 and 1.0230 could become their favorites.

On the downside, 1.0075 and 1.0050 may limit nearby declines, a break of which highlights 100-day simple moving average (SMA) on the daily chart around 1.0010.

Should there be additional south-run under 1.0010, 200-day SMA near 0.9950 may gain market attention.

USD/CHF hourly chart

Trend: Pullback expected

    1. R3 1.0147
    2. R2 1.0123
    3. R1 1.0104
  1. PP 1.008
    1. S1 1.0061
    2. S2 1.0037
    3. S3 1.0018

Author

Anil Panchal

Anil Panchal

FXStreet

Anil Panchal has nearly 15 years of experience in tracking financial markets. With a keen interest in macroeconomics, Anil aptly tracks global news/updates and stays well-informed about the global financial moves and their implications.

More from Anil Panchal
Share:

Editor's Picks

EUR/USD tests nine-day EMA support near 1.1850

EUR/USD inches lower during the Asian hours on Monday, trading around 1.1870 at the time of writing. The 14-day Relative Strength Index momentum indicator at 56 stays above the midline, confirming improving momentum. RSI has cooled from prior overbought readings but stabilizes above 50, suggesting dips could stay limited before buyers reassert control.

GBP/USD flat lines as traders await key UK macro data and FOMC minutes

The GBP/USD pair kicks off a new week on a subdued note and oscillates in a narrow range, just below mid-1.3600s, during the Asian session. Moreover, the mixed fundamental backdrop warrants some caution for aggressive traders as the market focus now shifts to this week's important releases from the UK and the US.

Gold slides below $5,000 amid USD uptick and positive risk tone; downside seems limited

Gold attracts fresh sellers at the start of a new week and reverses a part of Friday's strong move up of over $150 from sub-$4,900 levels. The commodity slides back below the $5,000 psychological mark during the Asian session, though the downside potential seems limited amid a combination of supporting factors.

Bitcoin, Ethereum and Ripple consolidate within key ranges as selling pressure eases

Bitcoin and Ethereum prices have been trading sideways within key ranges following the massive correction. Meanwhile, XRP recovers slightly, breaking above the key resistance zone. The top three cryptocurrencies hint at a potential short-term recovery, with momentum indicators showing fading bearish signs.

Global inflation watch: Signs of cooling services inflation

Realized inflation landed close to expectations in January, as negative base effects weighed on the annual rates. Remaining sticky inflation is largely explained by services, while tariff-driven goods inflation remains limited even in the US.

Ripple Price Forecast: XRP potential bottom could be in sight

Ripple edges up above the intraday low of $1.35 at the time of writing on Friday amid mixed price actions across the crypto market. The remittance token failed to hold support at $1.40 the previous day, reflecting risk-off sentiment amid a decline in retail and institutional sentiment.