|

USD/CHF stuck just below 0.8900 as Swiss Franc holds steady

  • The USD/CHF is cycling 0.8880 with the Franc frozen in place after recent gains.
  • The CHF is up almost 2.2% against the USD peak-to-trough on the week.
  • Safe haven appetite remains a key theme underpinning market flows, to the benefit of the Franc.

The USD/CHF is spreading around the 0.8880 level as market risk appetite sours, but risk flights pull just short of moving their bets on the Swiss Franc (CHF).

The Franc (CHF) has gained appreciably against the US Dollar (USD) recently, with the CHF's safe haven popularity in the EU bloc apparent and the Swiss National Bank (SNB) determined to defend the CHF using outright market purchases as much as necessary.

Despite a backlog of short bets on the CHF, the SNB's backstopping has prevented any meaningful depreciation on the Franc, and despite inflation near 1.7% in the Swiss economy, Switzerland is enjoying an enviable position.

The SNB's steadily hawkish tone and Switzerland's large net account surplus is keeping the USD/CHF pinned in place despite broad-market sentiment shifts.

USD/CHF Technical Outlook

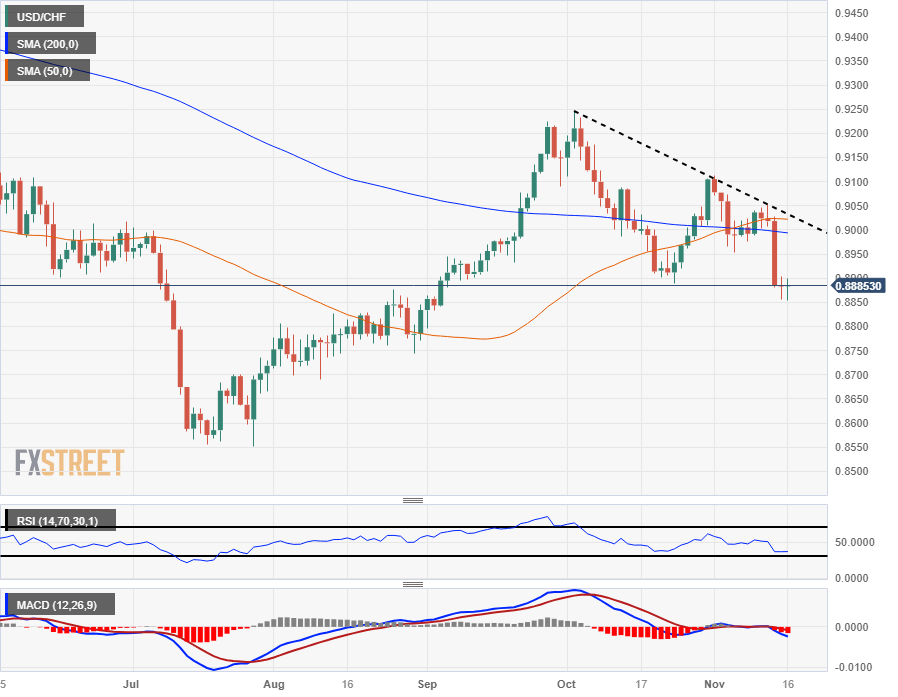
The USD/CHF dropped sharply this week into the 0.8850 neighborhood frrom the 200-day Simple Moving Average (SMA) at the 0.9000 handle, and the pair is testing into multi-month lows, with September's low bids near 0.8800 within reach.

The pair has been etching in a pattern of lower highs since peaking near 0.9250 in early October. The last swing high sits at 0.9050, near the congestion zone of the 200- and 50-day SMAs.

USD/CHF Daily Chart

USD/CHF Technical Level

USD/CHF

Overview
Today last price0.8881
Today Daily Change-0.0003
Today Daily Change %-0.03
Today daily open0.8884
 
Trends
Daily SMA200.8988
Daily SMA500.9023
Daily SMA1000.8901
Daily SMA2000.8995
 
Levels
Previous Daily High0.8903
Previous Daily Low0.8855
Previous Weekly High0.9046
Previous Weekly Low0.8954
Previous Monthly High0.9244
Previous Monthly Low0.8888
Daily Fibonacci 38.2%0.8873
Daily Fibonacci 61.8%0.8885
Daily Pivot Point S10.8858
Daily Pivot Point S20.8833
Daily Pivot Point S30.881
Daily Pivot Point R10.8906
Daily Pivot Point R20.8929
Daily Pivot Point R30.8954

Author

Joshua Gibson

Joshua joins the FXStreet team as an Economics and Finance double major from Vancouver Island University with twelve years' experience as an independent trader focusing on technical analysis.

More from Joshua Gibson
Share:

Editor's Picks

AUD/USD languishes near two-month low amid renewed Iran tensions

AUD/USD holds above 0.7000 during the Asian session on Wednesday, though it remains close to a nearly two-month low set the previous day. Fresh US strikes on Iran temper hopes for a peace deal and benefit the safe-haven US Dollar. Furthermore, inflationary concerns continue to fuel hawkish Fed expectations, lending additional support to the buck ahead of the US CPI report. Adding to this, reduced bets on an RBA rate hike in June cap the currency pair.


USD/JPY sits near 160.50 intervention zone as bulls shrug off Japan's strong PPI

USD/JPY consolidates just below mid-160.00s, or its highest level since late April, as economic concerns stemming from the Middle East conflict continue to undermine the Japanese Yen (JPY). Furthermore, a fresh wave of US strikes on Iran benefits the safe-haven US Dollar and acts as a tailwind for the currency pair, countering Japan's hotter-than-expected PPI report. However, intervention fears cap the upside as traders seem hesitant ahead of the US consumer inflation figures later this Wednesday.

Gold flirts with $4,200, lowest since March 23 on hawkish Fed bets

Gold drops to a fresh low since March 23, around the $4,200 mark during the Asian session on Wednesday, as fresh US strikes on Iran fuel inflationary concerns and bolster bets for more hawkish central banks, including the US Fed. Meanwhile, US Dollar bulls are turning cautious ahead of the US CPI report, which could limit bullion losses. However, the recent breakdown below the 200-day SMA suggests that the path of least resistance for the XAU/USD is to the downside.

Bitcoin sell-off pushes over 50% of circulating supply into loss, hinting at market bottom

Bitcoin dropped near $61,000 on Tuesday, with the latest sell-off pushing long-term market indicators toward levels historically associated with bear-market bottoms, according to a report by K33 Research.

When the chips are down, the AI tape starts to shake

The market came into Tuesday trying to sell investors the comforting ”Turnaround Tuesday” idea that Friday’s AI fracture was just another pothole on the road higher. By the close, that story had lost its bid. Monday’s dead cat bounce had done what dead cat bounces always do.

The US economy defies the rules: 100 days into the Oil shock and the recession signal is still missing

More than three months after the start of the Iran war and the resulting disruption to global energy markets, the US economy continues to display remarkable resilience. The conflict has triggered a sharp rise in Oil prices, reignited inflationary pressures and fueled widespread concerns about a potential economic slowdown.