USD/CHF Price Forecast: Sinks to a two-week low near 0.8200 amid safe-haven demand
- The Franc surges nearly 1% as Trump’s tariff threats trigger risk aversion and deepen the US Dollar’s slide.
- USD/CHF breaks below 0.8250, nearing key support at May’s low of 0.8184.
- Bearish flag breakdown points to a possible test of the 2025 low at 0.8038.
- Traders pile into Swiss Franc as US protectionism and fiscal risks spook markets.

USD/CHF continues to weaken as the downtrend extends past 0.8250, as the pair loses almost 1%. Investors seeking safety bought the Swiss Franc (CHF) after US President Donald Trump threatened to enact tariffs of 50% on the European Union (EU) and 25% on Apple’s iPhone manufactured overseas. At the time of writing, the pair trades at 0.8203, at new two-week lows.
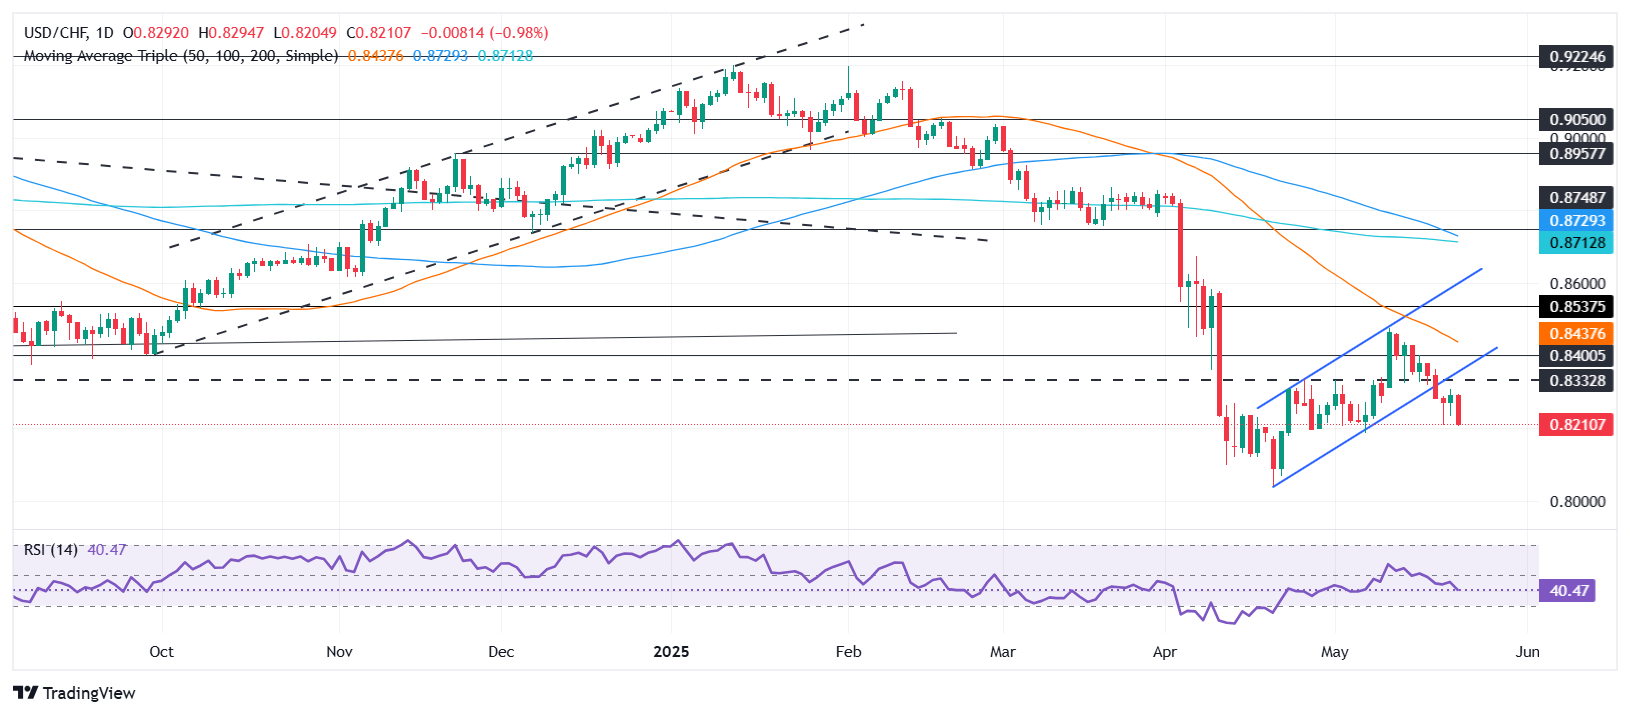
USD/CHF Price Forecast: Technical outlook
As of writing, the USD/CHF pair is tilted to the downside after clearing the bottom of a ‘bearish flag’ pattern, which indicates that the pair might test the current year-to-date (YTD) low of 0.8038.
Momentum favors further downside, as USD/CHF has achieved a successive series of lower highs and lower lows, with the Relative Strength Index (RSI) remaining in bearish territory.
On its way towards the YTD low, USD/CHF must drop below 0.8200. A breach of the latter will expose May’s low of 0.8184, followed by 0.8100 and the 0.8050 mark.
On the upside, buyers need to clear the May 22 peak of 0.8396, ahead of the 0.8350 and 0.8400.
USD/CHF Price Chart – Daily
Swiss Franc PRICE This week
The table below shows the percentage change of Swiss Franc (CHF) against listed major currencies this week. Swiss Franc was the strongest against the US Dollar.
| USD | EUR | GBP | JPY | CAD | AUD | NZD | CHF | |
|---|---|---|---|---|---|---|---|---|
| USD | -1.58% | -1.84% | -1.90% | -1.78% | -1.42% | -1.72% | -1.86% | |
| EUR | 1.58% | -0.29% | -0.28% | -0.14% | 0.29% | -0.08% | -0.28% | |
| GBP | 1.84% | 0.29% | -0.27% | 0.15% | 0.58% | 0.21% | 0.00% | |
| JPY | 1.90% | 0.28% | 0.27% | 0.13% | 0.65% | 0.38% | 0.09% | |
| CAD | 1.78% | 0.14% | -0.15% | -0.13% | 0.37% | 0.06% | -0.14% | |
| AUD | 1.42% | -0.29% | -0.58% | -0.65% | -0.37% | -0.37% | -0.56% | |
| NZD | 1.72% | 0.08% | -0.21% | -0.38% | -0.06% | 0.37% | -0.20% | |
| CHF | 1.86% | 0.28% | -0.01% | -0.09% | 0.14% | 0.56% | 0.20% |
The heat map shows percentage changes of major currencies against each other. The base currency is picked from the left column, while the quote currency is picked from the top row. For example, if you pick the Swiss Franc from the left column and move along the horizontal line to the US Dollar, the percentage change displayed in the box will represent CHF (base)/USD (quote).
Author

Christian Borjon Valencia
FXStreet
Markets analyst, news editor, and trading instructor with over 14 years of experience across FX, commodities, US equity indices, and global macro markets.


