USD/CHF Price Forecast: Rejection at 0.8345 brings 0.8265 support into focus
- US Dollar has been capped at 0.8345 before retreating to levels right above the 0.8265 support area.
- Enthisiasm about the ban on Trump's trade tariffs has waned.
- The immediate bias remains positive while above 0.8265 and 0.8215.

The US Dollar rallied earlier on Thursday, to find sellers at the 0.8345 area. The pair is showing marginal gains on the daily chart, but a test of the 0.8265 support is on the cards, with the Dollar retreating against its main peers.
A sentence from a US federal court blocking Trump’s tariffs on US trade partners boosted demand for the US Dollar in a relief rally earlier today. The Greenback, however, lost momentum as the market digested the news, with investors increasingly cautious ahead of US GDP and Weekly Jobless Claims releases.
USD/CHF Technical analysis: The immediate trend remains positive
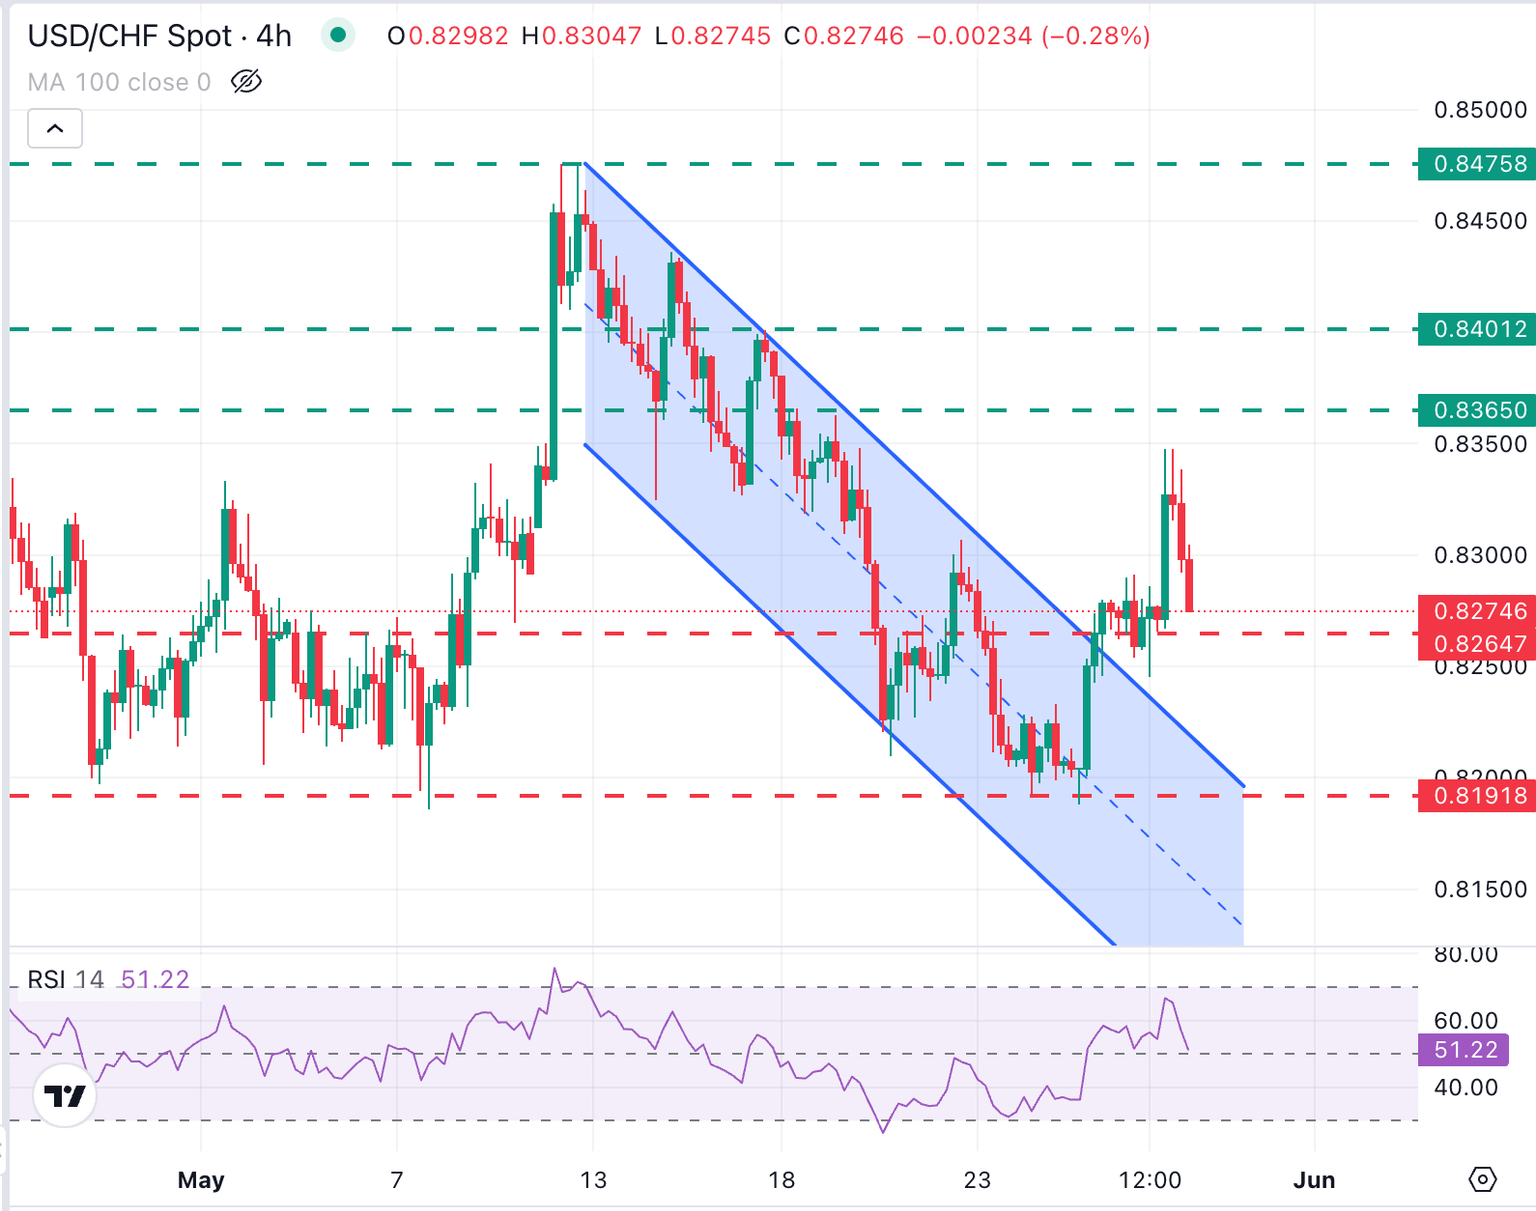
From a technical perspective, the immediate USD/CHF bias remains positive, although the 4-hour RSI is approaching the key 50 level that divides the bullish from the bearish territory.
The break above the descending channel and the “Morning Star” candle formation in the daily chart suggest that the pair might have set a bottom at the 0.8190 area and is heading higher.
Resistance levels are at the May 20 high, 0.8365 and the May 16 high, at 0.8400. On the downside, a break of the mentioned 0.8265 and the reverse trendline, now at 0.8215, would cancel this view.
USD/CHF 4-Hour Chart
Swiss Franc PRICE Today
The table below shows the percentage change of Swiss Franc (CHF) against listed major currencies today. Swiss Franc was the strongest against the Japanese Yen.
| USD | EUR | GBP | JPY | CAD | AUD | NZD | CHF | |
|---|---|---|---|---|---|---|---|---|
| USD | 0.10% | 0.02% | 0.09% | -0.06% | -0.20% | 0.03% | 0.16% | |
| EUR | -0.10% | -0.07% | 0.02% | -0.16% | -0.25% | -0.07% | 0.05% | |
| GBP | -0.02% | 0.07% | 0.08% | -0.08% | -0.16% | 0.00% | 0.04% | |
| JPY | -0.09% | -0.02% | -0.08% | -0.16% | -0.33% | -0.11% | -0.04% | |
| CAD | 0.06% | 0.16% | 0.08% | 0.16% | -0.19% | 0.10% | 0.12% | |
| AUD | 0.20% | 0.25% | 0.16% | 0.33% | 0.19% | 0.18% | 0.20% | |
| NZD | -0.03% | 0.07% | 0.00% | 0.11% | -0.10% | -0.18% | 0.02% | |
| CHF | -0.16% | -0.05% | -0.04% | 0.04% | -0.12% | -0.20% | -0.02% |
The heat map shows percentage changes of major currencies against each other. The base currency is picked from the left column, while the quote currency is picked from the top row. For example, if you pick the Swiss Franc from the left column and move along the horizontal line to the US Dollar, the percentage change displayed in the box will represent CHF (base)/USD (quote).
Author

Guillermo Alcala
FXStreet
Graduated in Communication Sciences at the Universidad del Pais Vasco and Universiteit van Amsterdam, Guillermo has been working as financial news editor and copywriter in diverse Forex-related firms, like FXStreet and Kantox.


