|

USD/CHF Price Analysis: Wednesday’s hanging man, monthly resistance line highlight 0.9100 for bears

  • USD/CHF directs the previous day’s failure to cross 0.9150 towards 0.9100 round-figure.
  • 50-day SMA, 61.8% Fibonacci retracement offer immediate supports amid bearish MACD.
  • Bulls can target 0.9200 after the trendline break.

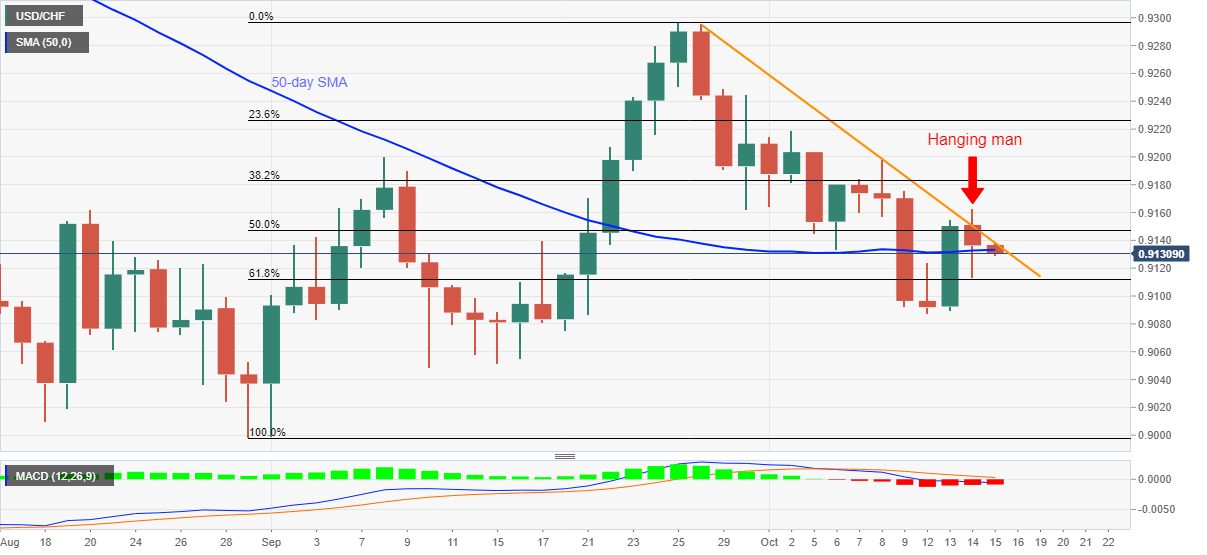
USD/CHF drops to 0.9131, down 0.05%, while heading into the European session on Thursday. In doing so, the pair respects the previous day’s pullback from a falling trend line stretched from September 28. Additionally, bearish MACD and Wednesday’s hanging man candlestick offer extra support to the pair sellers.

As a result, the immediate support of 50-day SMA, near 0.9130, followed by 61.8% Fibonacci retracement of September month’s upside, near 0.9110, may fail to stop the USD/CHF bears before offering them the 0.9100 thresholds.

Though, the monthly low of 0.9087 and the September 10 bottom around 0.9050 can surely challenge the quote’s further selling towards the prior month’s low of 0.8998.

On the upside, a clear break of the mentioned trend line, at 0.9140 now, will trigger a fresh run-up towards the previous week’s peak near 0.9200 However, the monthly high near 0.9220 and 0.9245 can probe USD/CHF upside then after.

During the quote’s sustained rise past-0.9245, September 25 peak close to 0.9300 will lure the buyers.

USD/CHF daily chart

Trend: Bearish

Additional important levels

Overview
Today last price0.9132
Today Daily Change-4 pips
Today Daily Change %-0.04%
Today daily open0.9136
 
Trends
Daily SMA200.9177
Daily SMA500.9133
Daily SMA1000.9274
Daily SMA2000.948
 
Levels
Previous Daily High0.9163
Previous Daily Low0.9114
Previous Weekly High0.9203
Previous Weekly Low0.9093
Previous Monthly High0.9296
Previous Monthly Low0.8999
Daily Fibonacci 38.2%0.9132
Daily Fibonacci 61.8%0.9144
Daily Pivot Point S10.9112
Daily Pivot Point S20.9088
Daily Pivot Point S30.9063
Daily Pivot Point R10.9162
Daily Pivot Point R20.9187
Daily Pivot Point R30.9211

Author

Anil Panchal

Anil Panchal

FXStreet

Anil Panchal has nearly 15 years of experience in tracking financial markets. With a keen interest in macroeconomics, Anil aptly tracks global news/updates and stays well-informed about the global financial moves and their implications.

More from Anil Panchal
Share:

Editor's Picks

EUR/USD drops below 1.1600 on broad USD strength

EUR/USD stays under bearish pressure and trades at a fresh six-week low below 1.1600 on Tuesday. Despite stronger-than-forecast inflation data from the Eurozone, the pair struggles to stage a rebound as the US Dollar continues to attract safe haven flows amid escalating geopolitical tensions in the Middle East. 

GBP/USD attacks 1.3300, refreshing three-month lows

GBP/USD is deep in the red near 1.3300, accelerating its downside to renew three-month lows in European trading on Tuesday. The ongoing escalation in the Iran war, combined with rising Oil prices, weighs negatively on the higher-yielding Pound Sterling as the US Dollar capitalizes on increased haven demand.

Gold drops below $5,200 on stronger USD, rallying US yields

Gold attracts some intraday selling and falls below $5,200 on Tuesday. The US Dollar climbs to a fresh high since January 20 and turns out to be a key factor exerting downward pressure on the commodity. Meanwhile, the benchmark 10-year US Treasury bond yield rises nearly 2% on the day, putting additional weight on XAU/USD's shoulders.

Crypto Today: Bitcoin, Ethereum, XRP pull back as sentiment remains in extreme market fear

The cryptocurrency market is broadly in the red on Tuesday as the Middle East grapples with an escalating war. Bitcoin (BTC) is in a pullback, trading below $67,000 at the time of writing, and most altcoins follow suit.

Middle East conflict ramps up a gear as energy price spike rips through markets

It’s another risk off day as geopolitical headwinds continue to batter financial markets. Although markets calmed during the US session and US stocks managed to post gains on Monday, this has not fed through to the European session, and stocks and bonds are sharply lower for a second day.

Hyperliquid Price Forecast: HYPE rises on commodities demand amid US-Iran war

Hyperliquid (HYPE) steadies above $33 at press time on Tuesday, marking its fourth consecutive day of recovery in a broadly volatile market due to the ongoing US-Israel strikes on Iran.