Crypto Today: Bitcoin, Ethereum, XRP pull back as sentiment remains in extreme market fear
- Bitcoin slips below $68,000 as sell-off jitters grip the broader crypto market following Monday’s upswing.
- Ethereum remains under pressure as sentiment in the crypto market remains in the "extreme fear" threshold.
- XRP edges lower from the daily open of $1.39 as the US-Iran war rages on.

The cryptocurrency market is broadly in the red on Tuesday as the Middle East grapples with an escalating war. Bitcoin (BTC) is in a pullback, trading below $67,000 at the time of writing, and most altcoins follow suit.
The Crypto King is down over 3% from the daily open of $68,830 and looks poised to erase most of the previous day's gains, extending the correction toward the next key support at $68,118.
As with Bitcoin, altcoins, including Ethereum (ETH) and Ripple (XRP), are trading under pressure amid negative market sentiment stemming from the war between the United States (US) and Iran.
Ethereum holds above $1,900; its upside appears limited by the supply in the lower $2,000s, while XRP is down by more than 3% to $1.35.
US-Iran war holds the crypto market in extreme fear sentiment
The US-Iran war is raging on for the fourth day, with no signs of cooling. According to a report by the Associated Press, US President Donald Trump expects the war to last several weeks. Iran continues its attacks on Middle East countries, striking the US Embassy in Riyadh, Saudi Arabia, early on Tuesday.
Global markets remain on alert amid the uncertainty, while countries around the world brace for higher energy and Oil prices. Crypto prices remain on edge as war, geopolitical tensions, and macroeconomic uncertainty rarely favour risk assets.
The Crypto Fear & Greed Index remains in extreme fear sentiment. Alternative data shows that investors have been fearful since early February. As investors take refuge on the sidelines, low liquidity limits the potential for a sustained recovery.
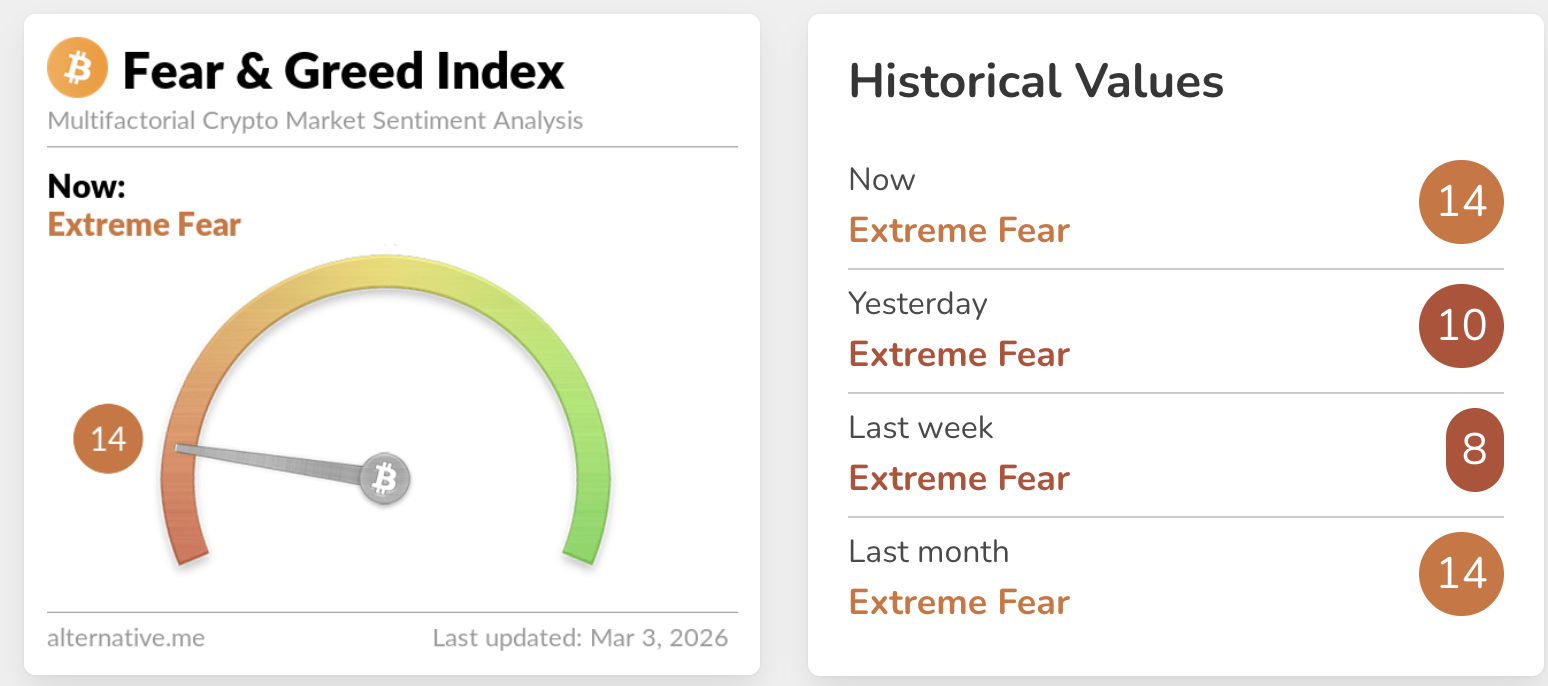
Chart of the day: Bitcoin slides as overhead pressure mounts
Bitcoin is trading above $66,000 as crypto prices pull back. The near-term bias is largely bearish as its price holds well below the SuperTrend line near $72,540. All three applied Exponential Moving Averages (EMAs) maintain a dominant overhead downtrend.
Although momentum had improved from deeply oversold conditions, with the Relative Strength Index (RSI) at 43 on the daily chart, lifting from sub-20 readings, it remains below the 50 midline. An extended decline in the RSI toward oversold territory would indicate that selling pressure is dominant. A break below the daily low at $66,340 could open the door to a correction targeting the range low support at $65,118.
Still, the Moving Average Convergence Divergence (MACD) remains above its signal line on the same chart while the histogram bars contract, reinforcing the view of a corrective bounce within a broader downtrend.
-1772534058060-1772534058062.png)
Initial resistance aligns with the daily open at $68,830, ahead of a stronger cap around $70,096, the Monday high. A decisive break past the 50-day EMA at $74,453 could mark a bullish shift.
Altcoins technical outlook: Ethereum and XRP hold key support
Ethereum is also trading amid rising selling pressure, sitting well below the downward-sloping 50-day, 100-day and 200-day EMAs. All three moving averages are clustered between $2,302 and $2,942, framing ETH's outlook in a broader corrective backdrop.
Meanwhile, the RSI near the low-40s on the daily chart has lifted from prior oversold readings, indicating fading bearish pressure but not yet strong upside momentum.
The MACD remains above its signal line, indicating that bullish influence is subtle. Histogram bars are contracting, suggesting sellers are gradually following Monday's uptick to a weekly high of $2,090.
Initial support lies near $1,900 ahead of the recent reaction low at $1,835 on Saturday. A break below this level would expose the next downside support around the February low at $1,748.
-1772535037111-1772535037113.png)
XRP is drifting lower at $1.35 amid a largely bearish outlook reinforced by the downward-sloping 50-day, 100-day and 200-day EMAs, clustered between $1.58 and $2.05. The remittance token lost upside momentum around $1.42 on Monday, weighed down by profit booking and risk-off sentiment.
Although the MACD indicator holds slightly above the signal line on the daily chart, the green histogram bars are contracting as upside momentum fades. Traders should temper their expectations and watch for a potential MACD crossover below the signal line, which may affirm the bearish thesis.
-1772536035977-1772536035979.png)
Initial resistance aligns with the daily open at $1.39, followed by Monday's high at $1.42. A daily close above $1.42 would be needed to challenge the 50-day EMA near $1.58 and weaken the current bearish tone.
Cryptocurrency prices FAQs
Token launches influence demand and adoption among market participants. Listings on crypto exchanges deepen the liquidity for an asset and add new participants to an asset’s network. This is typically bullish for a digital asset.
A hack is an event in which an attacker captures a large volume of the asset from a DeFi bridge or hot wallet of an exchange or any other crypto platform via exploits, bugs or other methods. The exploiter then transfers these tokens out of the exchange platforms to ultimately sell or swap the assets for other cryptocurrencies or stablecoins. Such events often involve an en masse panic triggering a sell-off in the affected assets.
Macroeconomic events like the US Federal Reserve’s decision on interest rates influence crypto assets mainly through the direct impact they have on the US Dollar. An increase in interest rate typically negatively influences Bitcoin and altcoin prices, and vice versa. If the US Dollar index declines, risk assets and associated leverage for trading gets cheaper, in turn driving crypto prices higher.
Halvings are typically considered bullish events as they slash the block reward in half for miners, constricting the supply of the asset. At consistent demand if the supply reduces, the asset’s price climbs.
(The technical analysis of this story was written with the help of an AI tool.)
Author

John Isige
FXStreet
John Isige is a seasoned cryptocurrency journalist and markets analyst committed to delivering high-quality, actionable insights tailored to traders, investors, and crypto enthusiasts. He enjoys deep dives into emerging Web3 tren



