|

USD/CHF Price Analysis: Trend-widening chart pattern, Doji candlestick advocate volatility

  • USD/CHF remains sidelined inside one-month-old megaphone formation.
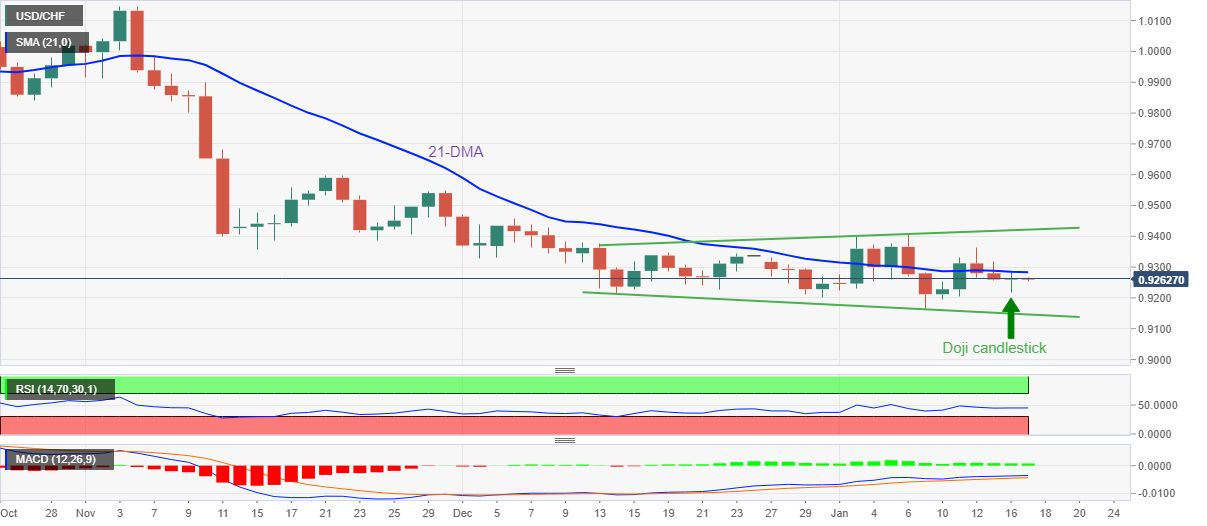
  • 21-DMA challenges recovery moves favored by Monday’s Doji candlestick.
  • Sluggish RSI line signals more grinding but bullish MACD signals probe bears of late.

USD/CHF steadiness near 0.9260-65 as the Swiss Franc (CHF) traders struggle to justify the previous day’s Doji candlestick during early Tuesday. In doing so, the major currency pair remains inside a one-month-long megaphone trend-widening chart formation.

That said, the steady RSI (14) suggests further grinding of the USD/CHF prices but the bullish MACD signals challenge the pair buyers. Additionally probing the quote’s immediate upside is the 21-DMA resistance near 0.9285.

It should be noted that the stated megaphone’s top line, close to 0.9420 by the press time, appears a tough nut to crack for the USD/CHF bulls before retaking control.

Ahead of that, the November 2022 low near 0.9355 may probe the recovery moves past 0.9285.

Alternatively, the 0.9200 round figure and the monthly bottom around 0.9165 could restrict the short-term USD/CHF downside ahead of highlighting the stated trend-widening chart pattern’s lower line, close to 0.9145 at the latest.

In a case where the USD/CHF bears keep the reins past 0.9145, the 0.9100 round figure will precede the previous yearly low of 0.9091 to please them.

Overall, USD/CHF is likely to remain sideways even if the pair sellers appear to have run out of steam of late.

USD/CHF: Daily chart

Trend: Limited downside expected

Additional important levels

Overview
Today last price0.9258
Today Daily Change-0.0005
Today Daily Change %-0.05%
Today daily open0.9263
 
Trends
Daily SMA200.9284
Daily SMA500.9385
Daily SMA1000.962
Daily SMA2000.9643
 
Levels
Previous Daily High0.9288
Previous Daily Low0.9219
Previous Weekly High0.9363
Previous Weekly Low0.9167
Previous Monthly High0.9471
Previous Monthly Low0.9201
Daily Fibonacci 38.2%0.9262
Daily Fibonacci 61.8%0.9245
Daily Pivot Point S10.9225
Daily Pivot Point S20.9187
Daily Pivot Point S30.9155
Daily Pivot Point R10.9295
Daily Pivot Point R20.9326
Daily Pivot Point R30.9364

Author

Anil Panchal

Anil Panchal

FXStreet

Anil Panchal has nearly 15 years of experience in tracking financial markets. With a keen interest in macroeconomics, Anil aptly tracks global news/updates and stays well-informed about the global financial moves and their implications.

More from Anil Panchal
Share:

Editor's Picks

EUR/USD tests nine-day EMA support near 1.1850

EUR/USD inches lower during the Asian hours on Monday, trading around 1.1870 at the time of writing. The 14-day Relative Strength Index momentum indicator at 56 stays above the midline, confirming improving momentum. RSI has cooled from prior overbought readings but stabilizes above 50, suggesting dips could stay limited before buyers reassert control.

GBP/USD flat lines as traders await key UK macro data and FOMC minutes

The GBP/USD pair kicks off a new week on a subdued note and oscillates in a narrow range, just below mid-1.3600s, during the Asian session. Moreover, the mixed fundamental backdrop warrants some caution for aggressive traders as the market focus now shifts to this week's important releases from the UK and the US.

Gold slides below $5,000 amid USD uptick and positive risk tone; downside seems limited

Gold attracts fresh sellers at the start of a new week and reverses a part of Friday's strong move up of over $150 from sub-$4,900 levels. The commodity slides back below the $5,000 psychological mark during the Asian session, though the downside potential seems limited amid a combination of supporting factors.

Bitcoin, Ethereum and Ripple consolidate within key ranges as selling pressure eases

Bitcoin and Ethereum prices have been trading sideways within key ranges following the massive correction. Meanwhile, XRP recovers slightly, breaking above the key resistance zone. The top three cryptocurrencies hint at a potential short-term recovery, with momentum indicators showing fading bearish signs.

Global inflation watch: Signs of cooling services inflation

Realized inflation landed close to expectations in January, as negative base effects weighed on the annual rates. Remaining sticky inflation is largely explained by services, while tariff-driven goods inflation remains limited even in the US.

Ripple Price Forecast: XRP potential bottom could be in sight

Ripple edges up above the intraday low of $1.35 at the time of writing on Friday amid mixed price actions across the crypto market. The remittance token failed to hold support at $1.40 the previous day, reflecting risk-off sentiment amid a decline in retail and institutional sentiment.