|

USD/CHF Price Analysis: Surges above 0.9000 as bulls eyeing 50-day EMA

  • USD/CHF pair surges past the 0.9000 figure, aiming for a 50-day EMA test at 0.9025 after printing a bullish hammer on the daily chart, turning bias to neutral upwards.
  • USD/CHF rally could challenge the 100-day EMA at 0.9137 if the 50-day EMA is breached, setting sights on the April 3 daily high of 0.9196.
  • Despite a neutral 3-day RoC, RSI indicates a bullish turn, suggesting USD/CHF bulls are gathering momentum.

USD/CHF climbs above the 0.9000 figure, eyeing a 50-day Exponential Moving Average (EMA) test at 0.9025 after printing a bullish hammer in the daily chart. The USD/CHF is trading at 0.9015, after hitting a daily low of 0.8975, trades above its opening price by 0.42%.

USD/CHF Price Analysis: Technical outlook

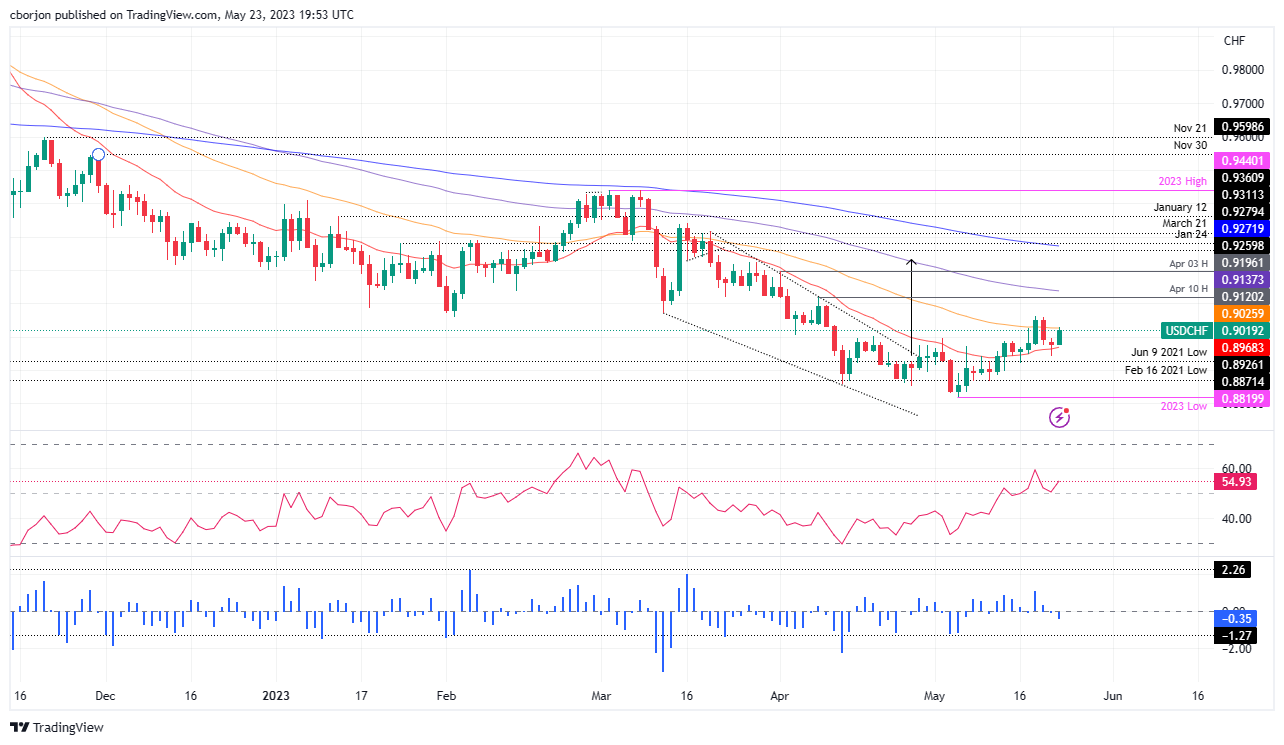
The USD/CHF pair is neutral to downward biased unless it claims the 50-day EMA at 0.9025, which would turn the bias to neutral upwards. It should be said the USD/CHF printed a new daily high, above the May 2 high of 0.8995, opening the door for further upside. If USD/CHF cracks the 50-day EMA, the pair will test last week's high of 0.9063 before rallying toward the 0.9100 mark. That would further cement a bullish bias, with the USD/CHF about to challenge the 100-day EMA at 0.9137, on its way to the April 3 daily high of 0.9196.

Notably, the Relative Strength Index (RSI) indicator turned bullish and just bounced off the 50-midline, a sign of USD/CHF bulls gathering momentum; while the 3-day Rate of Change (RoC) remains neutrally biased.

Therefore, the USD/CHF trend would likely continue upward. On the downside, the USD/CHF's first support would be the 0.9000 figure, which, once cleared, the pair would dip to the 20-day EMA At 0.8968.

USD/CHF Price Action – Daily chart

USD/CHF Daily chart

USD/CHF

Overview
Today last price0.9019
Today Daily Change0.0040
Today Daily Change %0.45
Today daily open0.8979
 
Trends
Daily SMA200.8938
Daily SMA500.9032
Daily SMA1000.9148
Daily SMA2000.94
 
Levels
Previous Daily High0.8997
Previous Daily Low0.8941
Previous Weekly High0.9063
Previous Weekly Low0.892
Previous Monthly High0.9198
Previous Monthly Low0.8852
Daily Fibonacci 38.2%0.8963
Daily Fibonacci 61.8%0.8976
Daily Pivot Point S10.8947
Daily Pivot Point S20.8916
Daily Pivot Point S30.8891
Daily Pivot Point R10.9004
Daily Pivot Point R20.9029
Daily Pivot Point R30.906

Author

Christian Borjon Valencia

Markets analyst, news editor, and trading instructor with over 14 years of experience across FX, commodities, US equity indices, and global macro markets.

More from Christian Borjon Valencia
Share:

Editor's Picks

EUR/USD: Breakdown below trading range support near 1.1770 comes into play

The EUR/USD pair opens with a bearish gap at the start of a new week as the US-Iran war-led global flight to safety boosts the US Dollar. Spot prices, however, lack follow-through selling and manage to hold above mid-1.1700s during the Asian session.

GBP/USD targets 1.3500 barrier near moving averages

GBP/USD rebounds from the daily losses, trading around 1.3450 during the Asian hours on Monday. The technical analysis of the daily chart indicates an ongoing bearish bias, as the pair trades within a descending channel pattern.

Gold retreats from $5,400; still up over 1% amid Middle East tensions

Gold retreats from the $5,400 neighborhood, or its highest level since late January, touched in the Asian session on Monday, though it manages to hold above the $5,300 round figure. The bright metal opened with a bullish gap of about $17 and rallied toward the $5,400 level as Asian traders hit their desks and reacted negatively to the weekend news of the US and Israel attacks on Iran, rushing for cover in Gold.

Top Crypto Losers: Tezos, Toncoin, and Polkadot at crucial levels amid US-Israel strike on Iran

Altcoins such as Tezos, Toncoin, and Polkadot rank among the worst hit cryptocurrencies over the last 24 hours amid the US and Israel's attack on Iran. Tezos and Toncoin are down to crucial support levels while Polkadot remains near a crucial resistance trendline, showcasing underlying strength.

The market is paying for insurance, not apocalypse

As expected, this morning felt less like a Monday market open and more like a fire drill. Futures screens flickered red. S&P contracts down almost 1%. Nasdaq off 1.2%. Brent leaped 13% through $80. Gold rose 1.6% toward $5350 before paring some gains. The dollar is strutting mildly. The Swiss franc is quietly doing what it always does in a storm, catching some safe-haven flows.

Starknet unveils strkBTC, shielded Bitcoin transactions on Ethereum Layer 2

Starknet, the Ethereum Layer 2 network developed by StarkWare, today announced strkBTC, a wrapped Bitcoin asset that introduces optional shielding while preserving full DeFi composability.