|

USD/CHF Price Analysis: Stays pressured near 0.8800 within immediate triangle, US PMI eyed

  • USD/CHF fades bounce off 100-SMA as traders await US S&P Global PMIs for August.
  • Fortnight-old ascending triangle restricts immediate moves of Swiss Franc pair.
  • Steady RSI, failure to defend recovery from key SMA lure pair sellers.
  • 200-SMA acts as additional check for bears; buyers need validation from “Golden Fibonacci Ratio”.

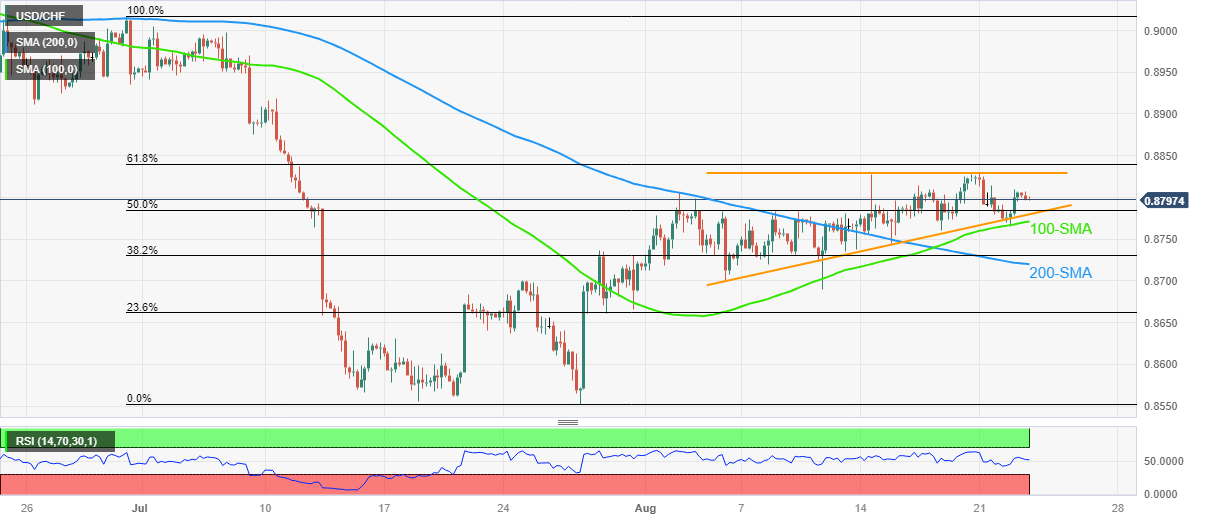
USD/CHF languishes around 0.8800 as it fades the previous day’s rebound from the 100-SMA heading into Wednesday’s European session. In doing so, the Swiss Franc (CHF) pair portrays the market’s cautious mood ahead of the preliminary readings of the August month Purchasing Managers Indexes (PMIs) for the US.

In addition to retreating towards the 100-SMA level of around 0.8780, the steady RSI (14) line and the existence of a 13-day-long rising triangle formation, currently between 0.8770 and 0.8830, also keep the USD/CHF sellers hopeful.

On a clear downside break of the 0.8770 mark, the Swiss Franc (CHF) pair sellers could aim for the 200-SMA support of 0.8720 before rushing toward the theoretical target of the triangle breakdown, around 0.8650.

Meanwhile, USD/CHF rebound needs to cross the top line of the aforementioned triangle, close to 0.8830, to convince intraday buyers.

Even so, the 61.8% Fibonacci retracement of the pair’s late June–July downside, near 0.8840, will act as the final defense of the pair bears.

Overall, the USD/CHF is likely to remain bearish unless crossing 0.8840. However, the downside move should draw support from the softer US S&P Global PMIs for August, as well as dovish Fed concerns, to dominate further.

USD/CHF: Four-hour chart

Trend: Limited downside expected

Additional important levels

Overview
Today last price0.88
Today Daily Change-0.0004
Today Daily Change %-0.05%
Today daily open0.8804
 
Trends
Daily SMA200.8754
Daily SMA500.8805
Daily SMA1000.8897
Daily SMA2000.9094
 
Levels
Previous Daily High0.8809
Previous Daily Low0.8765
Previous Weekly High0.8828
Previous Weekly Low0.8738
Previous Monthly High0.9005
Previous Monthly Low0.8552
Daily Fibonacci 38.2%0.8793
Daily Fibonacci 61.8%0.8782
Daily Pivot Point S10.8777
Daily Pivot Point S20.8749
Daily Pivot Point S30.8733
Daily Pivot Point R10.8821
Daily Pivot Point R20.8837
Daily Pivot Point R30.8865

Author

Anil Panchal

Anil Panchal

FXStreet

Anil Panchal has nearly 15 years of experience in tracking financial markets. With a keen interest in macroeconomics, Anil aptly tracks global news/updates and stays well-informed about the global financial moves and their implications.

More from Anil Panchal
Share:

Markets move fast. We move first.

Orange Juice Newsletter brings you expert driven insights - not headlines. Every day on your inbox.

By subscribing you agree to our Terms and conditions.

Editor's Picks

EUR/USD moves sideways below 1.1800 on Christmas Eve

EUR/USD struggles to find direction and trades in a narrow channel below 1.1800 after posting gains for two consecutive days. Bond and stock markets in the US will open at the usual time and close early on Christmas Eve, allowing the trading action to remain subdued. 

GBP/USD keeps range around 1.3500 amid quiet markets

GBP/USD keeps its range trade intact at around 1.3500 on Wednesday. The Pound Sterling holds the upper hand over the US Dollar amid pre-Christmas light trading as traders move to the sidelines heading into the holiday season. 

Gold retreats from record highs, trades below $4,500

Gold retreats after setting a new record-high above $4,520 earlier in the day and trades in a tight range below $4,500 as trading volumes thin out ahead of the Christmas break. The US Dollar selling bias remains unabated on the back of dovish Fed expectations, which continues to act as a tailwind for the bullion amid persistent geopolitical risks.

Bitcoin slips below $87,000 as ETF outflows intensify, whale participation declines

Bitcoin price continues to trade around $86,770 on Wednesday, after failing to break above the $90,000 resistance. US-listed spot ETFs record an outflow of $188.64 million on Tuesday, marking the fourth consecutive day of withdrawals.

Economic outlook 2026-2027 in advanced countries: Solidity test

After a year marked by global economic resilience and ending on a note of optimism, 2026 looks promising and could be a year of solid economic performance. In our baseline scenario, we expect most of the supportive factors at work in 2025 to continue to play a role in 2026.

Avalanche struggles near $12 as Grayscale files updated form for ETF

Avalanche trades close to $12 by press time on Wednesday, extending the nearly 2% drop from the previous day. Grayscale filed an updated form to convert its Avalanche-focused Trust into an ETF with the US Securities and Exchange Commission.