|

USD/CHF Price Analysis: Stays afloat above 0.9330, underpinned by a strong USD

  • USD/CHF resumed its uptrend as the 20-day EMA is about to cross over the 50-DMA.
  • USD/CHF Price Analysis: Could shift neutral-upwards once it regains 0.9400.

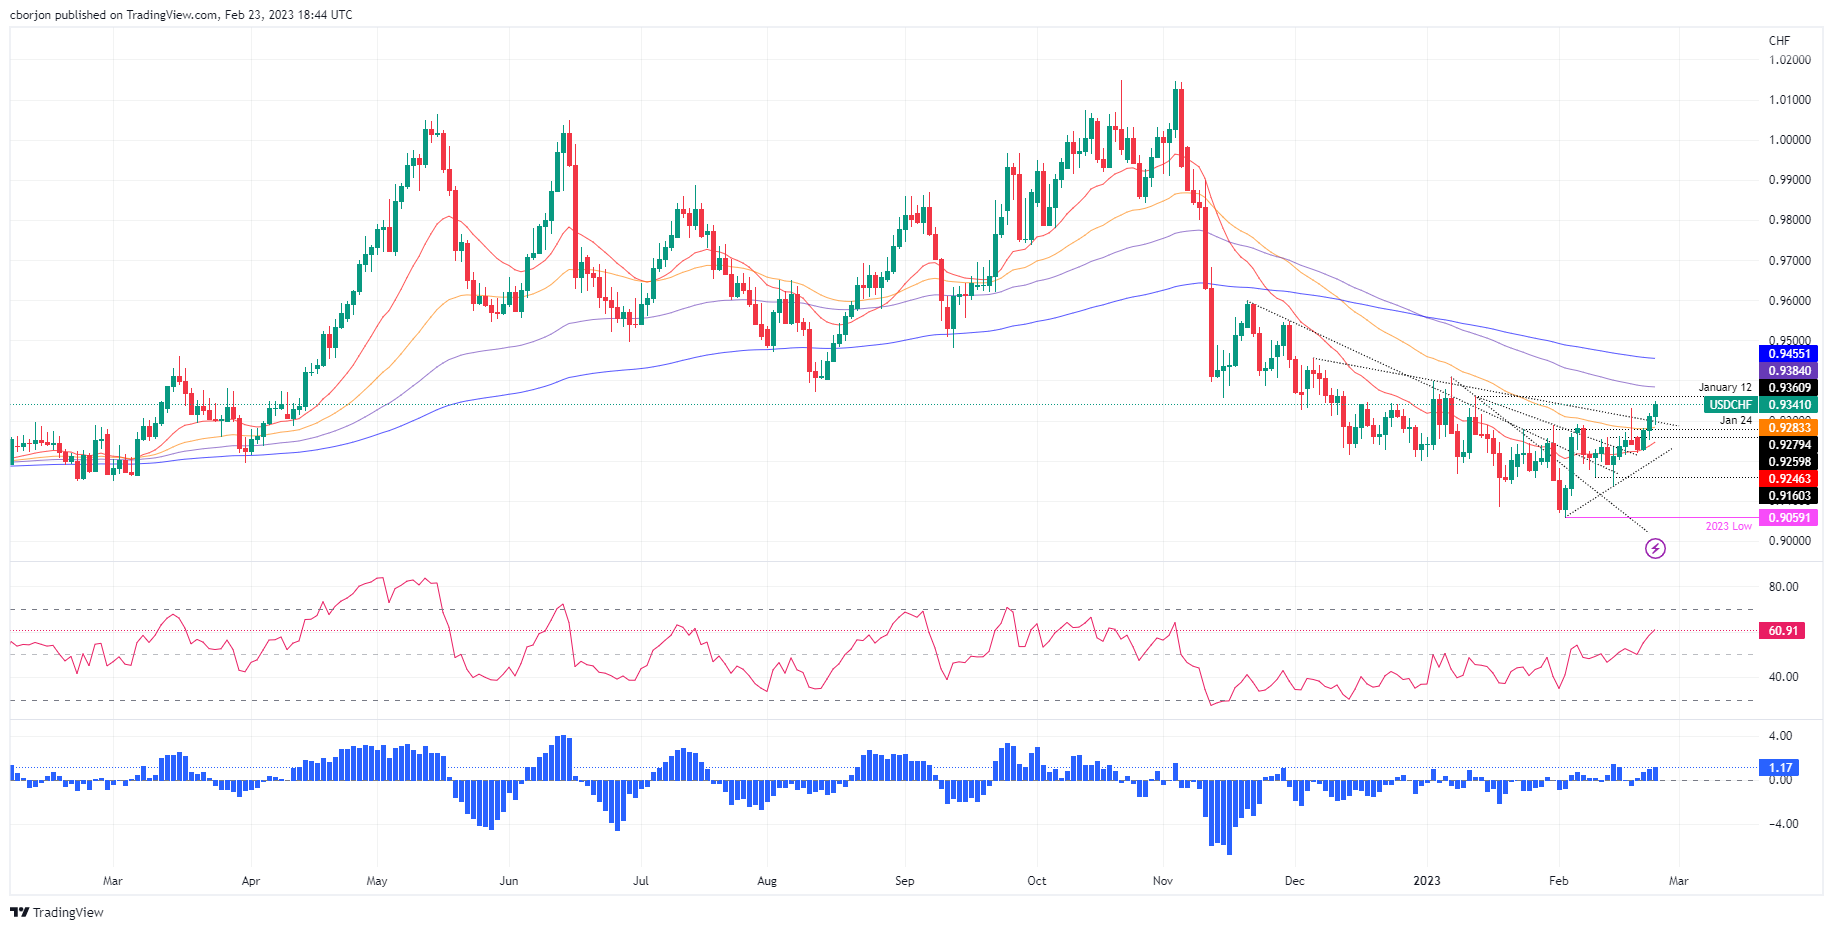
The USD/CHF climbs above 0.9300, extending its gains after cracking the previous weekly high and reaching a new one at 0.9348 on Thursday. At the time of typing, the USD/CHF exchanges hand at 0.9342.

The USD/CHF pair is neutral to downward biased, indicated by the long-term Exponential Moving Averages (EMAs), the 100 and 200-day EMAs, resting above the exchange rate at 0.9384 and 0.9455, respectively. Furthermore, the USD/CHF trades beneath the January 6 daily high of 0.9409, keeping the bearish bias intact. If this rate is surpassed, the USD/CHF can reach the 200-day EMA level.

Even though the USD/CHF bias is tilted to the downside, the pair appears to have bottomed around 0.9059. Also, the Relative Strength Index (RSI) and the Rate of Change (RoC) are bullish, suggesting buyers are moving in.

Therefore, the USD/CHF path of least resistance is upward in the near term. The first resistance would be the January 12 high at 0.9360. A decisive break and the following resistance tested would be the 100-day EMA at 0.9384, ahead of the 0.9400 figure. Once those two resistance areas are broken, buyers will aim toward the 200-day EMA at 0.9454 before posing a threat of the 0.9500 figure.

Contrarily, if the USD/CHF drops below the 50-day EMA at 0.9283, that would exacerbate a fall toward the February 14 daily low at 0.9135.

USD/CHF Daily chart

USD/CHF Key technical levels

USD/CHF

Overview
Today last price0.9343
Today Daily Change0.0028
Today Daily Change %0.30
Today daily open0.9315
 
Trends
Daily SMA200.9223
Daily SMA500.9249
Daily SMA1000.9476
Daily SMA2000.9576
 
Levels
Previous Daily High0.9319
Previous Daily Low0.9253
Previous Weekly High0.9332
Previous Weekly Low0.9138
Previous Monthly High0.941
Previous Monthly Low0.9085
Daily Fibonacci 38.2%0.9294
Daily Fibonacci 61.8%0.9278
Daily Pivot Point S10.9273
Daily Pivot Point S20.923
Daily Pivot Point S30.9207
Daily Pivot Point R10.9338
Daily Pivot Point R20.9361
Daily Pivot Point R30.9404

Author

Christian Borjon Valencia

Markets analyst, news editor, and trading instructor with over 14 years of experience across FX, commodities, US equity indices, and global macro markets.

More from Christian Borjon Valencia
Share:

Editor's Picks

AUD/USD falls to near 0.7100 after slipping below 50-day EMA

AUD/USD depreciates after registering minor gains in the previous day, trading around 0.7120 during the Asian hours. The technical analysis of the daily chart shows the pair consolidating sideways within a rectangle pattern, as neither bulls nor bears gain control. The AUD/USD pair is holding a slight bearish tone however as it sits beneath both the nine-day and 50-day EMAs.

160.00: USD/JPY back near intervention territory after upbeat US jobs report

US Nonfarm Payrolls beat expectations by a wide margin in May, with 172K jobs added. The US Dollar rebounds after the release, helping USD/JPY recover from its intraday lows. Warnings from Japanese authorities continue to limit upside potential near the 160.00 threshold.

Gold targets $4,300 amid stronger Dollar

Gold faces increasing selling interest and navigates the area of three-month lows near the $4,300 mark per troy ounce on Friday. The precious metal’s decline comes as traders assess the stronger-than-expected NFP, while the bid bias in the Greenback and higher US Treasury yields also collaborate with the retracement.

Cardano hits five-year low even as Hoskinson clarifies "break" isn't an exit

Cardano (ADA) price is down 10% at press time on Friday, extending losses over 30% so far this week amid Charles Hoskinson's clarification that "break" isn't an exit.

Week ahead – Fed countdown begins amid US inflation data and geopolitical risks

Fed Chair Warsh’s first meeting approaches as key US inflation data could reshape expectations. Oil prices remain elevated as US-Iran talks continue; tariffs also return to the spotlight. ECB is expected to hike; will it be a one-off move or is July live?

The US economy defies the rules: 100 days into the Oil shock and the recession signal is still missing

More than three months after the start of the Iran war and the resulting disruption to global energy markets, the US economy continues to display remarkable resilience. The conflict has triggered a sharp rise in Oil prices, reignited inflationary pressures and fueled widespread concerns about a potential economic slowdown.