|

USD/CHF Price Analysis: Retreats towards one-week-old support near 0.9250

  • USD/CHF pares the biggest daily gains in three weeks by reversing from golden Fibonacci ratio.
  • Multiple trend lines, 200-SMA stand tall to challenge downside move, RSI conditions also suggest further grinding towards the north.
  • Buyers seem to have a smooth road ahead of 0.9350 hurdle.

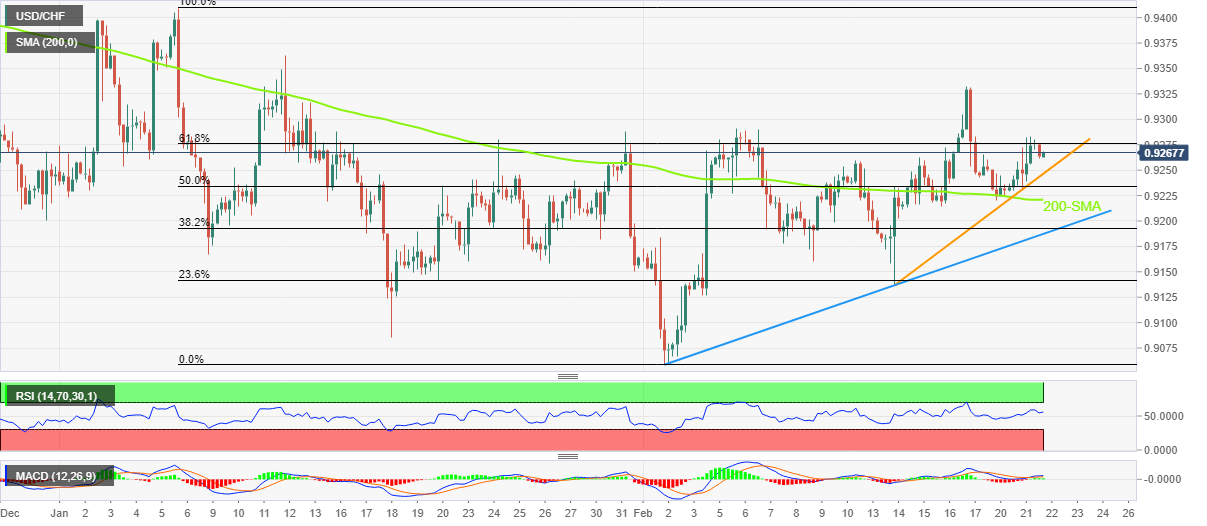
USD/CHF seesaws around 0.9265 as it consolidates the previous day’s gains with mild losses heading into Wednesday’s European session. In doing so, the Swiss Franc (CHF) pair makes a U-turn from the 61.8% Fibonacci retracement level, also known as the golden Fibonacci ratio, to pare the biggest daily jump since early February.

Even so, the most steady RSI (14), above 50, joins the bullish MACD signals, despite being sluggish of late, to keep the USD/CHF buyers hopeful.

That said, a one-week-old ascending trend line restricts the immediate downside of the USD/CHF pair near 0.9245.

Following that, the 50% Fibonacci retracement level and the 200-SMA could probe the bears around 0.9235 and 0.9220 in that order.

It’s worth noting that an upward-sloping support line from February 01, close to 0.9185 at the latest, appears the last defense of the USD/CHF bulls.

On the flip side, a clear break of the aforementioned key Fibonacci retracement level of 0.9275 could quickly propel the USD/CHF prices toward the 0.9300 round figure before highlighting the latest swing top near 0.9335.

Though, multiple hurdles near 0.9350 seem to challenge the USD/CHF pair’s upside past 0.9335, a break of which could easily challenge the previous monthly high surrounding 0.9490.

USD/CHF: Four-hour chart

Trend: Further upside expected

Additional important levels

Overview
Today last price0.9264
Today Daily Change-0.0012
Today Daily Change %-0.13%
Today daily open0.9276
 
Trends
Daily SMA200.9216
Daily SMA500.9247
Daily SMA1000.9481
Daily SMA2000.9579
 
Levels
Previous Daily High0.9283
Previous Daily Low0.9228
Previous Weekly High0.9332
Previous Weekly Low0.9138
Previous Monthly High0.941
Previous Monthly Low0.9085
Daily Fibonacci 38.2%0.9262
Daily Fibonacci 61.8%0.9249
Daily Pivot Point S10.9242
Daily Pivot Point S20.9208
Daily Pivot Point S30.9188
Daily Pivot Point R10.9297
Daily Pivot Point R20.9317
Daily Pivot Point R30.9352

Author

Anil Panchal

Anil Panchal

FXStreet

Anil Panchal has nearly 15 years of experience in tracking financial markets. With a keen interest in macroeconomics, Anil aptly tracks global news/updates and stays well-informed about the global financial moves and their implications.

More from Anil Panchal
Share:

Markets move fast. We move first.

Orange Juice Newsletter brings you expert driven insights - not headlines. Every day on your inbox.

By subscribing you agree to our Terms and conditions.

Editor's Picks

EUR/USD bounces toward 1.1750 as US Dollar loses strength

EUR/USD returned to the 1.1750 price zone in the American session on Friday, despite falling Wall Street, which indicates risk aversion. Trading conditions remain thin following the New Year holiday and ahead of the weekend, with the focus shifting to US employment and European data scheduled for next week.

GBP/USD nears 1.3500, holds within familiar levels

After testing 1.3400 on the last day of 2025, GBP/USD managed to stage a rebound. Nevertheless, the pair finds it difficult to gather momentum and trades with modest intraday gains at around 1.3490 as market participants remain in holiday mood.

Gold trims intraday gains, approaches $4,300

Gold retreated sharply from the $4,400  area and trades flat for the day in the $4,320 price zone. Choppy trading conditions exacerbated the intraday decline, although XAU/USD bearish case is out of the picture, considering growing expectations for a dovish Fed and persistent geopolitical tensions.

Cardano gains early New Year momentum, bulls target falling wedge breakout

Cardano kicks off the New Year on a positive note and is extending gains, trading above $0.36 at the time of writing on Friday. Improving on-chain and derivatives data point to growing bullish interest, while the technical outlook keeps an upside breakout in focus.

Economic outlook 2026-2027 in advanced countries: Solidity test

After a year marked by global economic resilience and ending on a note of optimism, 2026 looks promising and could be a year of solid economic performance. In our baseline scenario, we expect most of the supportive factors at work in 2025 to continue to play a role in 2026.

Crypto market outlook for 2026

Year 2025 was volatile, as crypto often is.  Among positive catalysts were favourable regulatory changes in the U.S., rise of Digital Asset Treasuries (DAT), adoption of AI and tokenization of Real-World-Assets (RWA).