|

USD/CHF Price Analysis: Recovery remains elusive below 0.8975

  • USD/CHF struggles to extend Friday’s recovery, clings to mild gains during three-day uptrend.
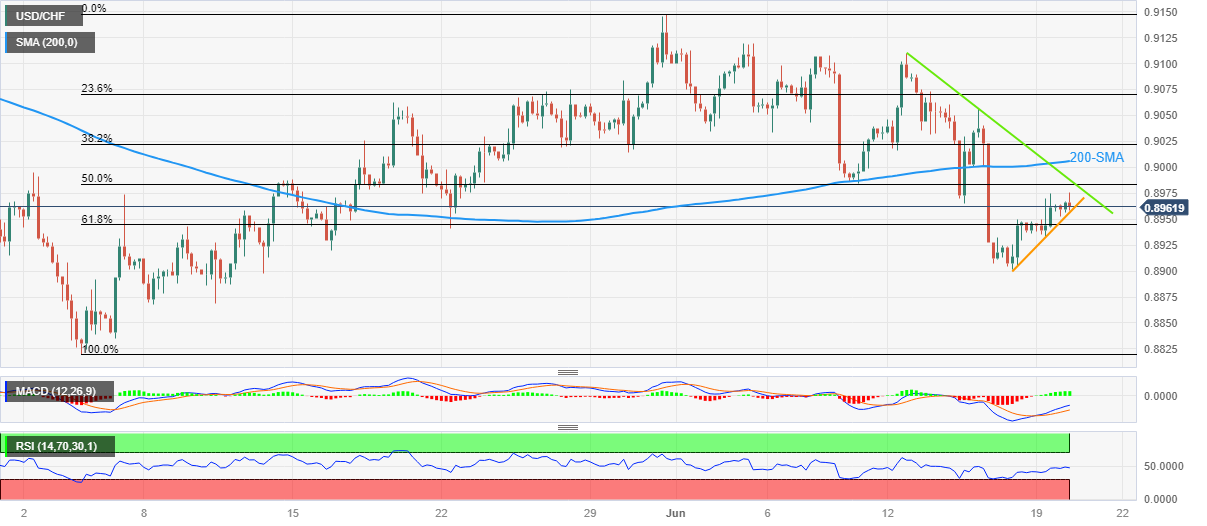
  • Steady RSI, clear break of 61.8% Fibonacci retracement suggests further advances.
  • Weekly resistance line, 200-SMA guards recovery moves before welcoming bulls.

USD/CHF reverses intraday gains as it fades bounce off an ascending support line from Friday heading into Tuesday’s European session, downbeat around 0.8960 by the press time. In doing so, the Swiss Franc (CHF) pair fails to defend the three-day recovery from the lowest level in five weeks.

The pullback moves, however, lack acceptance from the RSI and MACD oscillators as the former remains steady near the 50.0 level whereas the latter prints bullish signals.

Hence, the USD/CHF is likely to remain firmer past the immediate support line, close to 0.8955 at the latest.

Even if the quote breaks the nearby support line, the 61.8% Fibonacci retracement level of its May 04-31 upside, near 0.8945, will act as an extra filter toward the south.

It’s worth noting, however, that the USD/CHF pair’s weakness past 0.8945 won’t hesitate in refreshing the monthly low, currently around the 0.8900 round figure.

In that case, the previous monthly low of 0.8820, also the lowest level since early 2021, will be in the spotlight.

On the contrary, a one-week-old falling resistance line, around 0.8990 and the 0.9000 psychological magnet guard the immediate recovery of the USD/CHF pair.

Following that, the 200-SMA level of around 0.8975 acts as the final defense of the bears, a break of which will quickly cross the 0.9000 round figure ahead of directing the pair buyers toward the June 12 swing high of near 0.9110.

USD/CHF: Four-hour chart

Trend: Further upside expected

Additional important levels

Overview
Today last price0.8964
Today Daily Change0.0005
Today Daily Change %0.06%
Today daily open0.8959
 
Trends
Daily SMA200.9038
Daily SMA500.898
Daily SMA1000.9106
Daily SMA2000.9337
 
Levels
Previous Daily High0.8975
Previous Daily Low0.8934
Previous Weekly High0.9109
Previous Weekly Low0.8902
Previous Monthly High0.9148
Previous Monthly Low0.882
Daily Fibonacci 38.2%0.8959
Daily Fibonacci 61.8%0.8949
Daily Pivot Point S10.8937
Daily Pivot Point S20.8914
Daily Pivot Point S30.8895
Daily Pivot Point R10.8978
Daily Pivot Point R20.8997
Daily Pivot Point R30.9019

Author

Anil Panchal

Anil Panchal

FXStreet

Anil Panchal has nearly 15 years of experience in tracking financial markets. With a keen interest in macroeconomics, Anil aptly tracks global news/updates and stays well-informed about the global financial moves and their implications.

More from Anil Panchal
Share:

Markets move fast. We move first.

Orange Juice Newsletter brings you expert driven insights - not headlines. Every day on your inbox.

By subscribing you agree to our Terms and conditions.

Editor's Picks

EUR/USD moves sideways below 1.1800 on Christmas Eve

EUR/USD struggles to find direction and trades in a narrow channel below 1.1800 after posting gains for two consecutive days. Bond and stock markets in the US will open at the usual time and close early on Christmas Eve, allowing the trading action to remain subdued. 

GBP/USD keeps range around 1.3500 amid quiet markets

GBP/USD keeps its range trade intact at around 1.3500 on Wednesday. The Pound Sterling holds the upper hand over the US Dollar amid pre-Christmas light trading as traders move to the sidelines heading into the holiday season. 

Gold retreats from record highs, trades below $4,500

Gold retreats after setting a new record-high above $4,520 earlier in the day and trades in a tight range below $4,500 as trading volumes thin out ahead of the Christmas break. The US Dollar selling bias remains unabated on the back of dovish Fed expectations, which continues to act as a tailwind for the bullion amid persistent geopolitical risks.

Bitcoin slips below $87,000 as ETF outflows intensify, whale participation declines

Bitcoin price continues to trade around $86,770 on Wednesday, after failing to break above the $90,000 resistance. US-listed spot ETFs record an outflow of $188.64 million on Tuesday, marking the fourth consecutive day of withdrawals.

Economic outlook 2026-2027 in advanced countries: Solidity test

After a year marked by global economic resilience and ending on a note of optimism, 2026 looks promising and could be a year of solid economic performance. In our baseline scenario, we expect most of the supportive factors at work in 2025 to continue to play a role in 2026.

Avalanche struggles near $12 as Grayscale files updated form for ETF

Avalanche trades close to $12 by press time on Wednesday, extending the nearly 2% drop from the previous day. Grayscale filed an updated form to convert its Avalanche-focused Trust into an ETF with the US Securities and Exchange Commission.