|

USD/CHF Price Analysis: Reclaims the 20-DMA, as bull's eye the 50-DMA around 0.9300

  • USD/CHF jumped from weekly lows after forming a hammer at around the 0.9200 area.
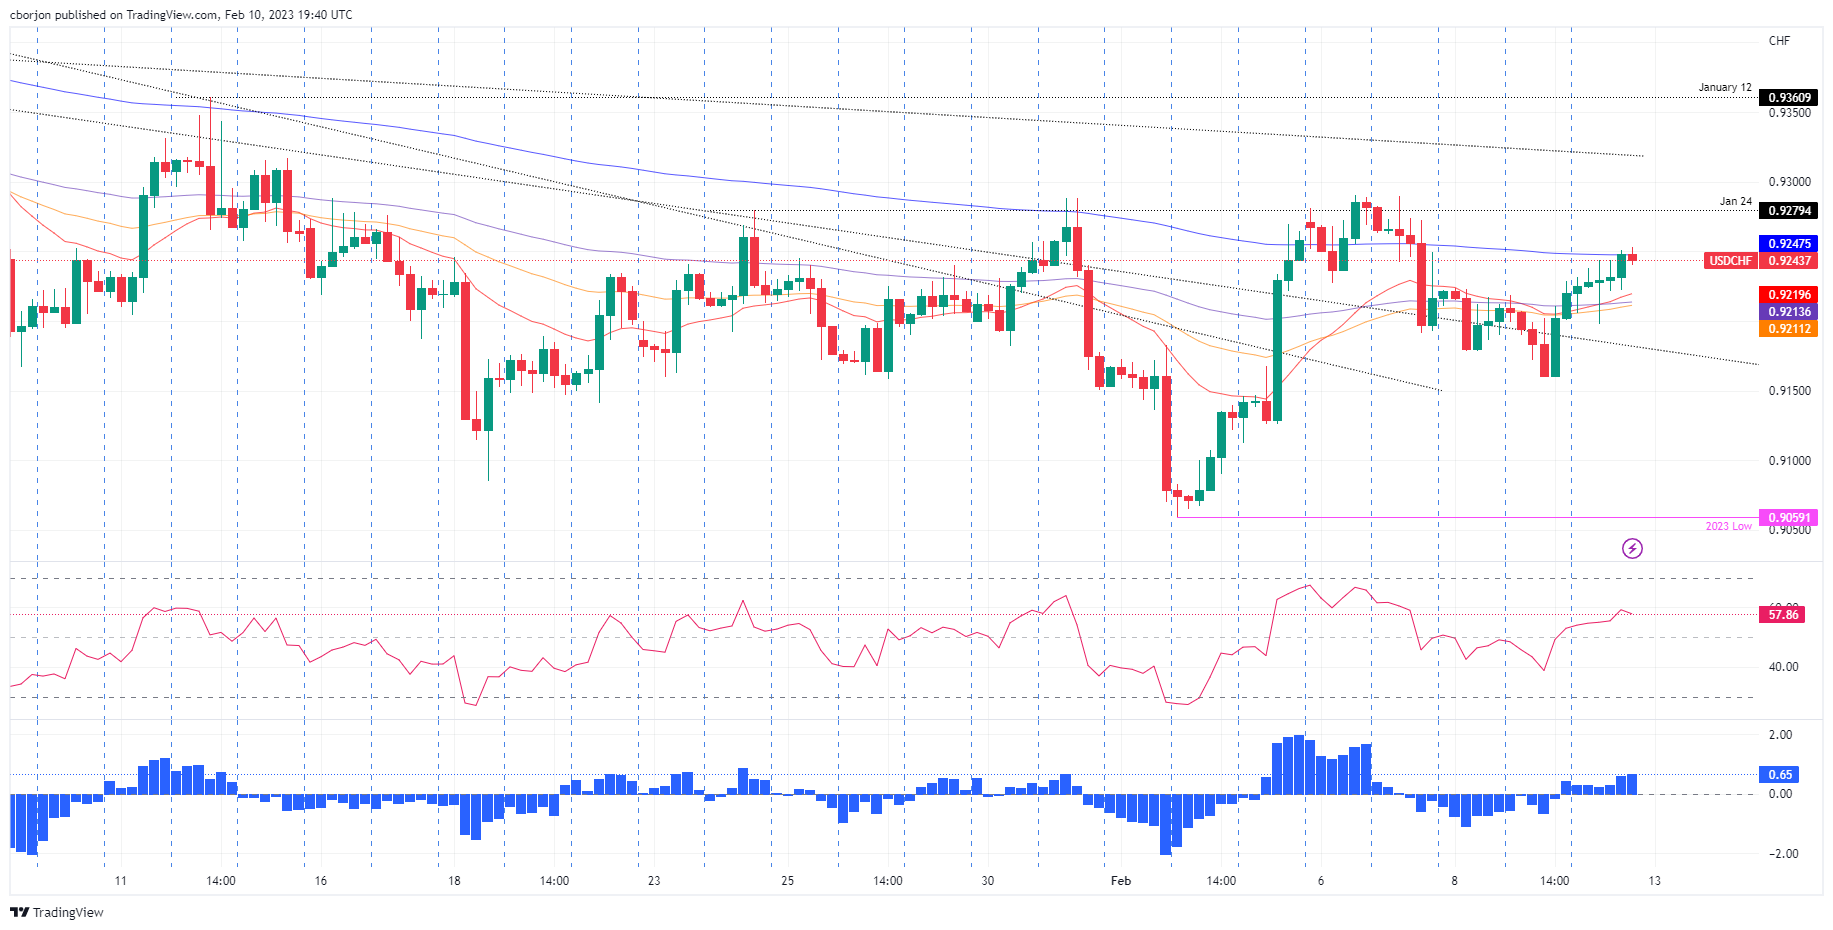
  • Near-term, the USD/CHF is upward biased and might test the 0.9300 figure.

The USD/CHF forged a base and climbed back to the 0.9200 area on Friday, following Thursday’s price action, which formed a hammer, that exacerbated the USD/CHF recovery, to current exchange rates. At the time of writing, the USD/CHF is trading at 0.9246, above its opening price by 0.35%.

Long-term, the USD/CHF remains neutral-to-downward biased, but it could print a leg-up and test the 50-day Exponential Moving Average (EMA) at 0.9294. The Relative Strength Index (RSI) entered bullish territory, suggesting that buying pressure is building, contrary to the Rate of Change (RoC), which is neutral.

Short term, the USD/CHF 4-hour chart is bottoming, though downside risks remain. At the time of typing, the USD/CHF is testing the 200-Exponential Moving Average (EMA) at 0.9247 after breaking away from the confluence of the 50/100/20-EMAs.

Oscillators like the Relative Strength Index (RSI) shifted bullish, while the Rate of Change (RoC) backed a bullish continuation, but key resistance areas need to be broken to further cement the USD/CHF upward bias.

Therefore, the USD/CHF first resistance would be the 200-EMA, followed by the 0.9300 figure. A decisive break could trigger a leg-up towards the January 12 high of 0.9360, ahead of the psychological 0.9400 figure.

USD/CHF 4-hour chart

USD/CHF key technical levels

USD/CHF

Overview
Today last price0.9246
Today Daily Change0.0019
Today Daily Change %0.21
Today daily open0.9227
 
Trends
Daily SMA200.9207
Daily SMA500.9269
Daily SMA1000.953
Daily SMA2000.9608
 
Levels
Previous Daily High0.9228
Previous Daily Low0.916
Previous Weekly High0.9288
Previous Weekly Low0.9059
Previous Monthly High0.941
Previous Monthly Low0.9085
Daily Fibonacci 38.2%0.9203
Daily Fibonacci 61.8%0.9186
Daily Pivot Point S10.9182
Daily Pivot Point S20.9137
Daily Pivot Point S30.9114
Daily Pivot Point R10.925
Daily Pivot Point R20.9273
Daily Pivot Point R30.9318

Author

Christian Borjon Valencia

Christian Borjon began his career as a retail trader in 2010, mainly focused on technical analysis and strategies around it. He started as a swing trader, as he used to work in another industry unrelated to the financial markets.

More from Christian Borjon Valencia
Share:

Markets move fast. We move first.

Orange Juice Newsletter brings you expert driven insights - not headlines. Every day on your inbox.

By subscribing you agree to our Terms and conditions.

Editor's Picks

EUR/USD trades around 1.1700 after rebounding from 50-day EMA

EUR/USD gains ground after three days of losses, trading around 1.1700 during the Asian hours on Wednesday. On the daily chart, technical analysis indicates a potential for a bearish bias; the 14-day Relative Strength Index at 47 confirms waning momentum.

GBP/USD climbs above 1.3500 as US Dollar weakens ahead of ISM Services PMI

GBP/USD gains some ground after registering modest gains in the previous session, trading around 1.3510 during the Asian hours on Wednesday. The pair edges higher as the US Dollar struggles ahead of the US ISM Services Purchasing Managers’ Index and JOLTs job openings due later in the day.

Gold pulls back from $4,500 amid profit-taking ahead of key US macro data

Gold struggles to capitalize on its strong weekly gains registered over the past two days and faces rejection near the $4,500 psychological mark, or over a one-week high touched during the Asian session on Wednesday. As investors digest the recent US attack on Venezuela, the prevalent risk-on environment prompts some profit-taking around the commodity. 

Bitcoin, Ethereum and Ripple cool off as rally stalls near key resistance zones

Bitcoin, Ethereum, and Ripple prices are taking a breather on Wednesday near their key resistance levels following the recent surge. BTC faces rejection at the $94,253 level, while ETH and XRP follow BTC’s footsteps, struggling near $3,308 and $2.35, respectively.

Implications of US intervention in Venezuela

Events in Venezuela are top of mind for market participants, and while developments are associated with an elevated degree of uncertainty, we are not making any changes to our markets or economic forecasts as a result of the deposition of Nicolás Maduro. 

Aave Price Forecast: AAVE eyes bullish breakout as on-chain and derivatives data turns supportive

Aave (AAVE) price hovers around $172 on Wednesday, nearing the upper trendline of the falling parallel channel pattern. A break above this technical pattern favors the bulls.