|

USD/CHF Price Analysis: Fortnight-old resistance line, Doji prod bulls near 0.8950

  • USD/CHF fades week-start recovery near short-term key resistance line, stays sidelined of late.
  • Bearish candlestick formation, sluggish RSI also signal pullback moves.
  • Convergence of 50-SMA, one-week-old ascending trend line restrict short-term downside.
  • Bulls have a bumpy road to ride unless crossing 200-SMA.

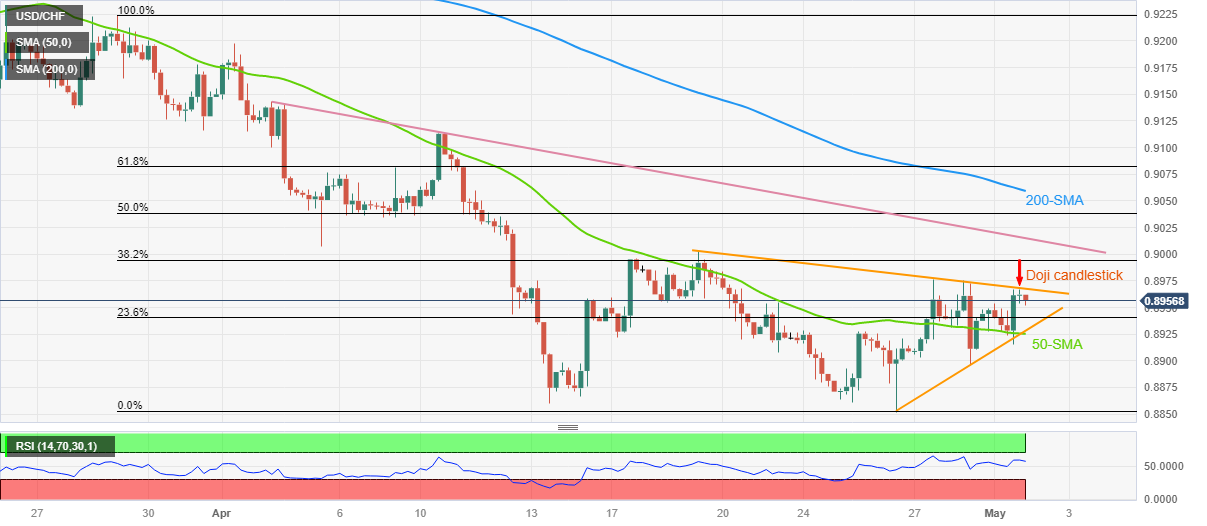
USD/CHF seesaws around 0.8950-60 following a failure to cross a two-week-old resistance line during early Tuesday. In doing so, the Swiss Franc (CHF) pair justifies the previous day’s Doji candlestick while positing mild losses near the stated price after an upward start to the week.

With this, the USD/CHF price is likely to decline towards the 0.8925-20 support confluence comprising the 50-SMA and a one-week-old ascending support line.

In a case where the USD/CHF bears keep the reins past 0.8920, the 0.8900 round figure and the previous monthly low, also the yearly low around 0.8850, will be in the spotlight.

It’s worth noting that the pair’s weakness past 0.8850 will make it vulnerable to dropping toward the year 2021 low of around 0.8755.

On the flip side, the aforementioned resistance line, near 0.8965 by the press time, precedes the late April swing high of around 0.8975 to restrict the immediate USD/CHF upside.

Following that, a one-month-old downward-sloping resistance line and the 200-SMA, respectively near 0.9015 and 0.9060, will be in the spotlight.

Overall, USD/CHF remains depressed but the bears are likely running out of steam, which in turn highlights the 0.8925-20 support confluence.

USD/CHF: Four-hour chart

Trend: Further downside expected

Additional important levels

Overview
Today last price0.8956
Today Daily Change0.0012
Today Daily Change %0.13%
Today daily open0.8944
 
Trends
Daily SMA200.8982
Daily SMA500.9157
Daily SMA1000.9204
Daily SMA2000.9448
 
Levels
Previous Daily High0.8975
Previous Daily Low0.8896
Previous Weekly High0.8976
Previous Weekly Low0.8852
Previous Monthly High0.9198
Previous Monthly Low0.8852
Daily Fibonacci 38.2%0.8926
Daily Fibonacci 61.8%0.8945
Daily Pivot Point S10.8902
Daily Pivot Point S20.8859
Daily Pivot Point S30.8822
Daily Pivot Point R10.8981
Daily Pivot Point R20.9018
Daily Pivot Point R30.906

Author

Anil Panchal

Anil Panchal

FXStreet

Anil Panchal has nearly 15 years of experience in tracking financial markets. With a keen interest in macroeconomics, Anil aptly tracks global news/updates and stays well-informed about the global financial moves and their implications.

More from Anil Panchal
Share:

Markets move fast. We move first.

Orange Juice Newsletter brings you expert driven insights - not headlines. Every day on your inbox.

By subscribing you agree to our Terms and conditions.

Editor's Picks

EUR/USD recovers to 1.1750 region as 2025 draws to a close

Following the bearish action seen in the European session on Wednesday, EUR/USD regains its traction and recovery to the 1.1750 region. Nevertheless, the pair's volatility remains low as trading conditions thin out on the last day of the year.

GBP/USD stays weak near 1.3450 on modest USD recovery

GBP/USD remains under modest beairsh pressure and fluctuates at around 1.3450 on Wednesday. The US Dollar finds fresh demand due to the end-of-the-year position adjustments, weighing on the pair amid the pre-New Year trading lull. 

Gold retreats to $4,300 area, looks to post monthly gains

Gold stays on the back foot on the last day of 2025 and trades near $4,300, possibly pressured by profit-taking and position adjustments. Nevertheless, XAU/USD remains on track to post gains for December and extend its winning streak into a fifth consecutive month.

Bitcoin, Ethereum and XRP prepare for a potential New Year rebound

Bitcoin, Ethereum, and Ripple are holding steady on Wednesday after recording minor gains on the previous day. Technically, Bitcoin could extend gains within a triangle pattern while Ethereum and Ripple face critical overhead resistance. 

Economic outlook 2026-2027 in advanced countries: Solidity test

After a year marked by global economic resilience and ending on a note of optimism, 2026 looks promising and could be a year of solid economic performance. In our baseline scenario, we expect most of the supportive factors at work in 2025 to continue to play a role in 2026.

Crypto market outlook for 2026

Year 2025 was volatile, as crypto often is.  Among positive catalysts were favourable regulatory changes in the U.S., rise of Digital Asset Treasuries (DAT), adoption of AI and tokenization of Real-World-Assets (RWA).