|

USD/CHF Price Analysis: Clings to 0.9300 after a hawkish Fed

  • On Thursday, the Swiss franc collapsed almost 1%, as Fed policymakers eye the first rate hike in the March meeting.
  • The US Dollar Index marches firmly above 97.00 for the first time since 2020.
  • USD/CHF is upward biased, though a retracement before resuming the uptrend is on the cards.

During the North American session, the USD/CHF advances close to 1%, trading above 0.9300 for the first time since November 2021 highs. At the time of writing, the USD/CHF exchanges hands at 0.9312.

A risk-on market mood dented the prospects of the Swiss franc, which usually rallies on risk aversion. In the meantime, the US Dollar marches firmly throughout the session, with the US Dollar Index (DXY) advancing 1.23%, sitting at 97.131.

USD/CHF Price Forecast: Technical outlook

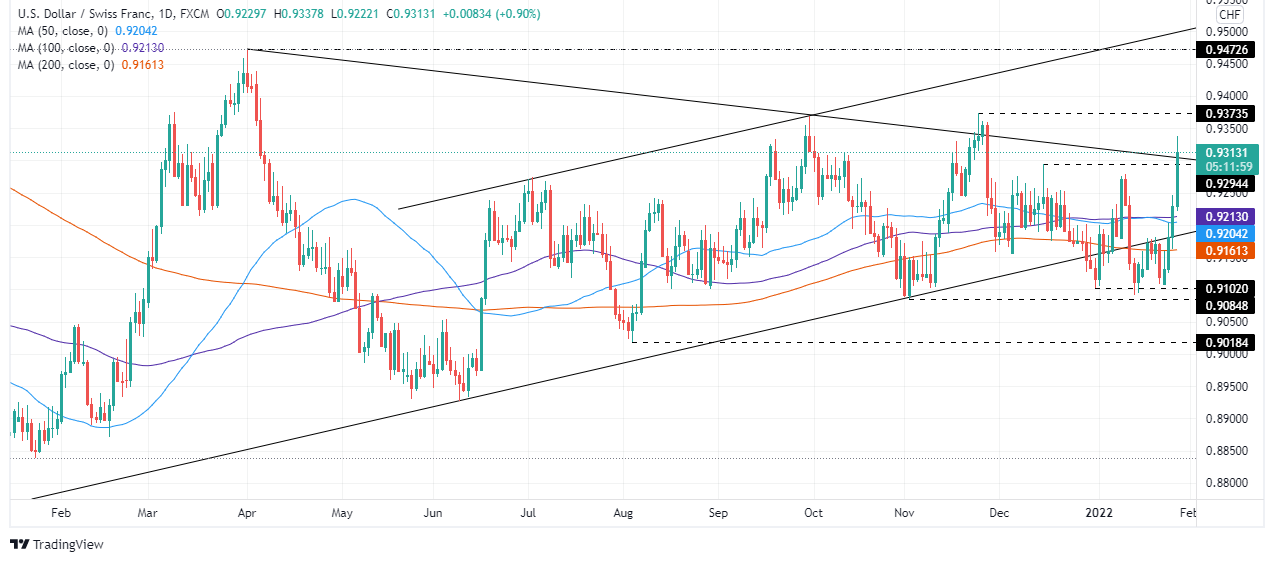
The USD/CHF is upward biased. On Wednesday, the pair broke resistance levels on its way towards 0.9300, like the 50 and 100-day moving averages (DMAs), lying at 0.9204 and 0.9212. Furthermore, it broke a downslope resistance trendline drawn from April – September 2021 cycle highs that pass around the 0.9300-05 area. However, due to the nature of the movement, a pullback towards the figure, or December 15, 2021, a daily high at 0.9294, is on the cards.

That said, the USD/CHF first support is 0.9300. A break of that level immediately suggests a test of December 15, 2021, high at 0.9294, followed by a January 26 daily high at 0.9246.

Contrarily, to the upside, the first resistance is November 2021 cycle high at 0.9373. A breach of the latter would expose the 0.9400 figure, followed by April 2021, swing highs at 0.9472.

USD/CHF

Overview
Today last price0.9312
Today Daily Change0.0074
Today Daily Change %0.80
Today daily open0.9238
 
Trends
Daily SMA200.9172
Daily SMA500.9207
Daily SMA1000.9215
Daily SMA2000.9164
 
Levels
Previous Daily High0.9246
Previous Daily Low0.9171
Previous Weekly High0.9181
Previous Weekly Low0.9108
Previous Monthly High0.9295
Previous Monthly Low0.9102
Daily Fibonacci 38.2%0.9218
Daily Fibonacci 61.8%0.92
Daily Pivot Point S10.9191
Daily Pivot Point S20.9143
Daily Pivot Point S30.9116
Daily Pivot Point R10.9266
Daily Pivot Point R20.9294
Daily Pivot Point R30.9341

Author

Christian Borjon Valencia

Markets analyst, news editor, and trading instructor with over 14 years of experience across FX, commodities, US equity indices, and global macro markets.

More from Christian Borjon Valencia
Share:

Editor's Picks

AUD/USD falls to near 0.7100 after slipping below 50-day EMA

AUD/USD depreciates after registering minor gains in the previous day, trading around 0.7120 during the Asian hours. The technical analysis of the daily chart shows the pair consolidating sideways within a rectangle pattern, as neither bulls nor bears gain control. The AUD/USD pair is holding a slight bearish tone however as it sits beneath both the nine-day and 50-day EMAs.

160.00: USD/JPY back near intervention territory after upbeat US jobs report

US Nonfarm Payrolls beat expectations by a wide margin in May, with 172K jobs added. The US Dollar rebounds after the release, helping USD/JPY recover from its intraday lows. Warnings from Japanese authorities continue to limit upside potential near the 160.00 threshold.

Gold weakens to three-month lows near $4,300

Gold faces increasing selling interest and approaches the area of three-month lows near the $4,300 mark per troy ounce on Friday. The precious metal’s decline comes as traders assess the stronger-than-expected NFP, while the bid bias in the Greenback and higher US Treasury yields also collaborate with the retracement.

Cardano hits five-year low even as Hoskinson clarifies "break" isn't an exit

Cardano (ADA) price is down 10% at press time on Friday, extending losses over 30% so far this week amid Charles Hoskinson's clarification that "break" isn't an exit.

Week ahead – Fed countdown begins amid US inflation data and geopolitical risks

Fed Chair Warsh’s first meeting approaches as key US inflation data could reshape expectations. Oil prices remain elevated as US-Iran talks continue; tariffs also return to the spotlight. ECB is expected to hike; will it be a one-off move or is July live?

The US economy defies the rules: 100 days into the Oil shock and the recession signal is still missing

More than three months after the start of the Iran war and the resulting disruption to global energy markets, the US economy continues to display remarkable resilience. The conflict has triggered a sharp rise in Oil prices, reignited inflationary pressures and fueled widespread concerns about a potential economic slowdown.