|

USD/CHF Price Analysis: Climbs  to fresh two-week highs above 0.9800

  • USD/CHF extends its weekly gains to 1.98% after the Fed and SNB monetary policy decisions.
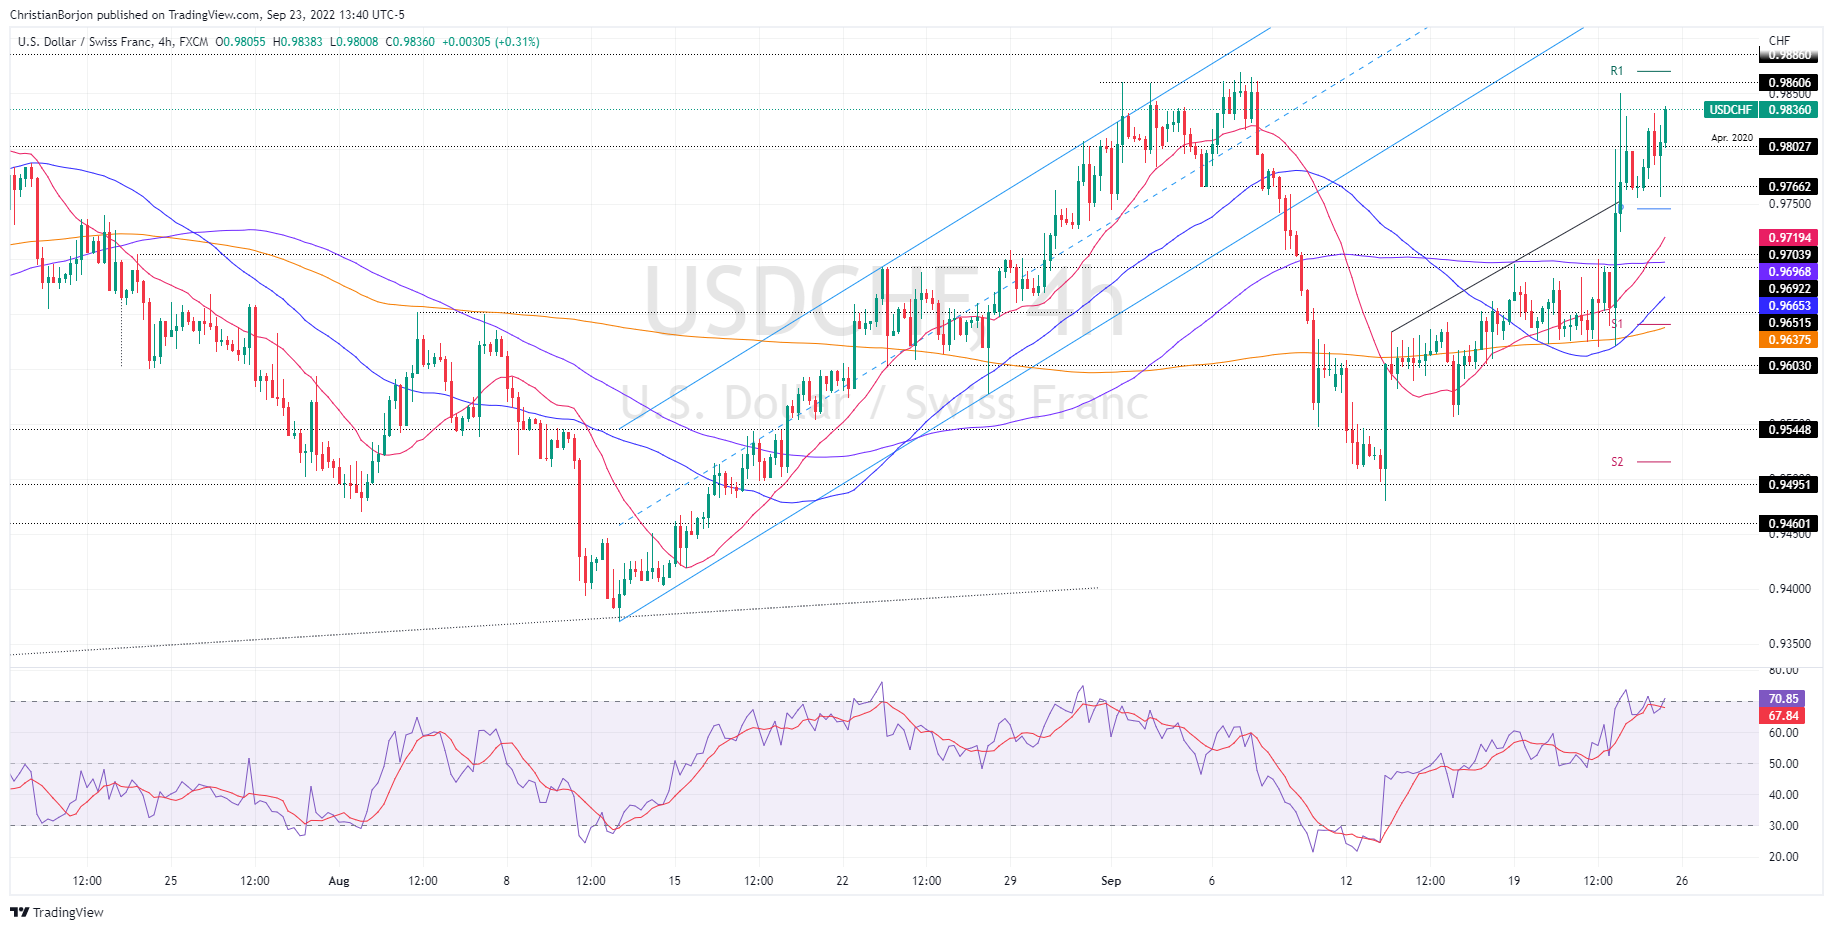
  • The major break above the 0.9600-0.9700 range, registering a fresh weekly high at 0.9851.
  • The USD/CHF path of least resistance is upwards; once it clears 0.9851, a re-test of 0.9900 is on the cards.

The USD/CHF advanced during Friday’s North American session, gaining 0.60%, courtesy of a risk-off impulse spurred by fears of a global economic slowdown and the Fed’s aggression as the US central bank struggles to temper inflation from around 40-year highs. At the time of writing, the USD/CHF is trading at 0.9836.

USD/CHF Price Analysis: Technical outlook

The central bank frenzy witnessed the Fed and the Swiss National Bank (SNB) hiking rates. Even though the SNB finished the period of negative rates, it wasn’t enough, according to market participants, which bought the USD/CHF, lifting the pair towards fresh weekly highs around 0.9851. Nevertheless, USD/CHF buyers have been unable to crack last week’s high at 0.9869, which could open the door for further gains.

Short term, the USD/CHF 4-hour chart, shifted from neutral to neutral-upward biased once the pair rallied above 0.9800, after trading sideways, in the 0.9600-0.9700 area throughout the week. Albeit the Relative Strength Index (RSI) got into overbought conditions, the USD/CHF upward bias remains intact.

Therefore, the USD/CHF first resistance is the weekly high at 0.9851. Break above will expose the R1 daily pivot at 0.9870, followed by the psychological 0.9900 mark.

On the other hand, the USD/CHF first support will be the daily pivot point at 0.9766. A breach of the latter will send the pair sliding to the 20-EMA at 0.9719, ahead of the 0.9700 figure.
USD/CHF Key Technical Levels

USD/CHF

Overview
Today last price0.9824
Today Daily Change0.0054
Today Daily Change %0.55
Today daily open0.977
 
Trends
Daily SMA200.9698
Daily SMA500.9631
Daily SMA1000.9687
Daily SMA2000.9494
 
Levels
Previous Daily High0.9851
Previous Daily Low0.9622
Previous Weekly High0.9661
Previous Weekly Low0.948
Previous Monthly High0.9808
Previous Monthly Low0.9371
Daily Fibonacci 38.2%0.9763
Daily Fibonacci 61.8%0.9709
Daily Pivot Point S10.9644
Daily Pivot Point S20.9519
Daily Pivot Point S30.9416
Daily Pivot Point R10.9873
Daily Pivot Point R20.9976
Daily Pivot Point R31.0102

Author

Christian Borjon Valencia

Markets analyst, news editor, and trading instructor with over 14 years of experience across FX, commodities, US equity indices, and global macro markets.


More from Christian Borjon Valencia
Share:

Editor's Picks

AUD/USD bulls seem hesitant below 0.7050 ahead of RBA on Tuesday

AUD/USD reverses an Asian session dip on Monday as renewed optimism over Iran diplomacy boosts investor confidence, keeping a lid on the safe-haven US Dollar and supporting the risk-sensitive Aussie. Spot prices, however, remain below the one-month high, touched last Thursday, as bulls wait for the crucial RBA decision before taking fresh positions.


USD/JPY climbs to 158.00 neighborhood as BoJ uncertainty weighs on the JPY

The USD/JPY pair gains some positive traction at the start of a new week, recovering further from Friday's post-Bank of Japan (BoJ) swing low to sub-157.00 levels. The momentum lifts spot prices to the 158.00 neighborhood during the Asian session and seems unaffected by fresh intervention warning from Japan's Finance Minister Satsuki Katayama.

Gold finds relief from Oil’s decline as traders await key US economic data

Gold retains a positive bias during American trading hours on Monday after sliding to a fresh yearly low of $3,870 on Friday and ending October down 6.87%. A pullback in Oil prices amid diplomatic efforts between the US and Iran supports the precious metal. However, the rebound lacks conviction as the fundamental backdrop continues to raise doubts over a sustained recovery.

Dogecoin risks deeper slide as whales diverge

Dogecoin hovers around $0.075 on Monday after falling for the fifth consecutive week since the end of September. Santiment data shows diverging whale activity, as large holders reduce their positions while smaller whale wallets accumulate tokens. Meanwhile, weakening on-chain metrics and a deteriorating technical outlook suggest that DOGE could remain vulnerable to further losses.

Why strong US growth could not stop the bond rally and AI selloff

The US economy grew at a 3.4% annual rate, yet Treasury yields fell and the Nasdaq ended October with its worst monthly performance since March 2025. The market is no longer rewarding capital expenditure simply because it supports growth. Investors are testing whether that expenditure can produce cash flow and returns above the cost of capital.


The 2% inflation target came from a throwaway remark. It now moves trillions
The Federal Reserve's 2% inflation goal grew out of an off-the-cuff remark by a New Zealand politician in 1988. Bond investors still price long-term US debt as if 2% holds, so a change in how the Fed measures inflation would move markets.