|

USD/CHF Price Analysis: Bulls remain in control, overbought conditions warrant caution

  • USD/CHF gained strong positive traction on Monday and shot fresh multi-month tops.
  • Extremely overbought RSI on the daily chart warrants some caution for bullish traders.
  • Any slide below 0.9300 might continue to attract some dip-buying and remain limited.

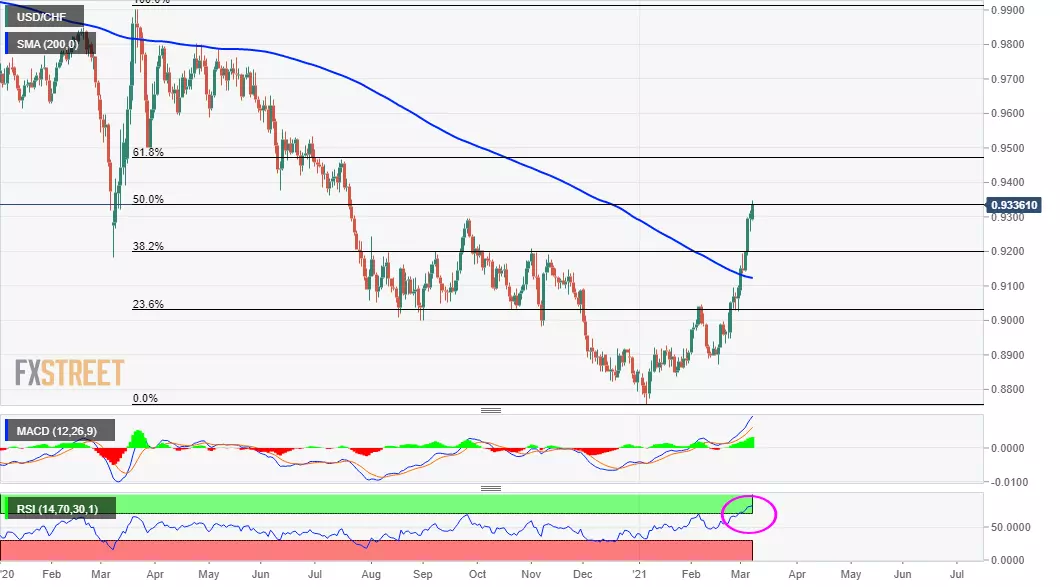
The USD/CHF pair caught some fresh bids on the first day of a new trading week and shot to the highest level since July 2020, around mid-0.9300s during the first half of the European session. The mentioned level marks the 50% Fibonacci level of the 0.9902-0.8758 downfall, which if cleared decisively will set the stage for additional gains.

Given the recent bullish breakout through the very important 200-day SMA and the 38.2% Fibo. level around the 0.9200 mark, the bias remains tilted in favour of bullish traders. The emergence of some dip-buying on Monday adds credence to the constructive outlook.

That said, extremely overbought conditions on the daily chart warrant some caution before positioning for any further appreciating move. This makes it prudent to wait for some near-term consolidation or a modest pullback before the USD/CHF pair prolongs its recent strong bullish trajectory.

Nevertheless, the USD/CHF pair seems all set to aim back to reclaim the 0.9400 round-figure mark and climb further towards testing the 61.8% Fibo. level, around the 0.9460 region.

On the flip side, the 0.9300 mark now seems to protect the immediate downside. Any further pullback might still be seen as a buying opportunity and remain limited near the daily swing lows, around the 0.9280-75 region. However, sustained weakness below might trigger some long-unwinding trade and drag the USD/CHF pair towards the 0.9200 mark (38.2% Fibo. level).

USD/CHF daily chart

fxsoriginal

Technical levels to watch

USD/CHF

Overview
Today last price0.9336
Today Daily Change0.0026
Today Daily Change %0.28
Today daily open0.931
 
Trends
Daily SMA200.9036
Daily SMA500.8946
Daily SMA1000.8985
Daily SMA2000.9124
 
Levels
Previous Daily High0.9319
Previous Daily Low0.9258
Previous Weekly High0.9319
Previous Weekly Low0.9071
Previous Monthly High0.9102
Previous Monthly Low0.8871
Daily Fibonacci 38.2%0.9296
Daily Fibonacci 61.8%0.9281
Daily Pivot Point S10.9272
Daily Pivot Point S20.9234
Daily Pivot Point S30.9211
Daily Pivot Point R10.9333
Daily Pivot Point R20.9357
Daily Pivot Point R30.9394

Author

Haresh Menghani

Haresh Menghani is a detail-oriented professional with 10+ years of extensive experience in analysing the global financial markets.

More from Haresh Menghani
Share:

Editor's Picks

EUR/USD: Bears retain control below 1.1780-1.1770 confluence breakpoint

The EUR/USD pair remains on the back foot through the Asian session on Friday and currently trades just above mid-1.1700s, well within striking distance of a nearly one-month low set the previous day.

GBP/USD seems vulnerable near one-month low as traders await US data

The GBP/USD pair prolongs its weekly downtrend for the fifth consecutive day on Friday and slides back closer to a nearly one-month low, touched the previous day. Spot prices trade below mid-1.3400s during the Asian session on Friday and seem vulnerable to slide further as traders now look to important US macro data for a fresh impetus.

Gold eyes next breakout on US GDP, PCE inflation data

Gold sticks to recent gains around the $5,000-mark early Friday, biding time before the high-impact US macro events. The focus is now on the US fourth-quarter Gross Domestic Product, core Personal Consumption Expenditures Price Index and the Supreme Court’s ruling on President Donald Trump’s tariffs.

Bitcoin, Ethereum and Ripple remain range-bound as breakdown risks rise

Bitcoin, Ethereum, and Ripple are trading sideways within consolidation ranges on Friday, signaling a lack of directional bias in the broader crypto market. BTC rebounded from key support, and ETH is nearing the lower consolidation boundary, while XRP is holding at its lower trendline boundary. 

Hawkish Fed minutes and a market finding its footing

It was green across the board for US Stock market indexes at the close on Wednesday, with most S&P 500 names ending higher, adding 38 points (0.6%) to 6,881 overall. At the GICS sector level, energy led gains, followed by technology and consumer discretionary, while utilities and real estate posted the largest losses.

Official Trump price approaches breakout with mixed signals from traders

Official Trump (TRUMP) is trading at $3.50 at the time of writing, approaching its upper consolidation range. A breakout from this range could open the door for an upside move. On-chain data shows market indecision, with balanced flows between bulls and bears, signaling a lack of clear directional bias.