|

USD/CHF fails to hold above the 20-day SMA amid weak US PMIs

  • The USD/CHF rises to a daily high of 0.9000, above the 20-day SMA, then retreats towards the 0.8960 area.
  • Soft Swiss inflation figures from June weakened the Swiss Franc during the European session.
  • US Manufacturing PMI dropped to 46 in June, weighing on the US Dollar.

At the start of the week, the USD/CHF saw some volatility but remained in positive territory. Soft inflation figures from Switzerland weakened the Swiss Franc leading USD/CHF to rise initially while falling Treasury yields made the USD lose interest following a soft Manufacturing Purchasing Managers Index (PMI) release. The pair remains in positive territory, however, but has erased its daily gains which had seen the pair jump to a high of 0.9000 during the European session.

US yields fall after weak US Manufacturing PMI

The latest release from the Institute for Supply Management's (ISM) Manufacturing Purchasing Managers Index (PMI) for June showed a reading of 46, coming in below the 47.2 expected and the previous figure of 46.9. 

Despite US yields retreating across the board, the Federal Reserve’s (Fed) hawkish expectations for July remain steady. According to the CME FedWatch Tool, a 25 basis points (bps) hike at the next meeting on July 31 is almost priced in, while the odds of another 25 bps hike in 2023 have risen to around 40%. In addition, markets await Non-Farm Payroll (NFP) data on Friday, which will continue modelling the expectations for the next Fed decision.

On the other hand, Switzerland's Consumer Price Index (CPI) declined to 1.7% in June, falling from 2.2% in May and falling short of the forecasted 1.8%. This drop brought the Swiss CPI back within the Swiss National Bank's (SNB) target range of 0% to 2%, marking the first time it has been within this range since January 2022. In that sense, dovish bets on the SNB seem to have weakened the CHF, but markets still discount at least one more hike this year.

USD/CHF Levels to watch

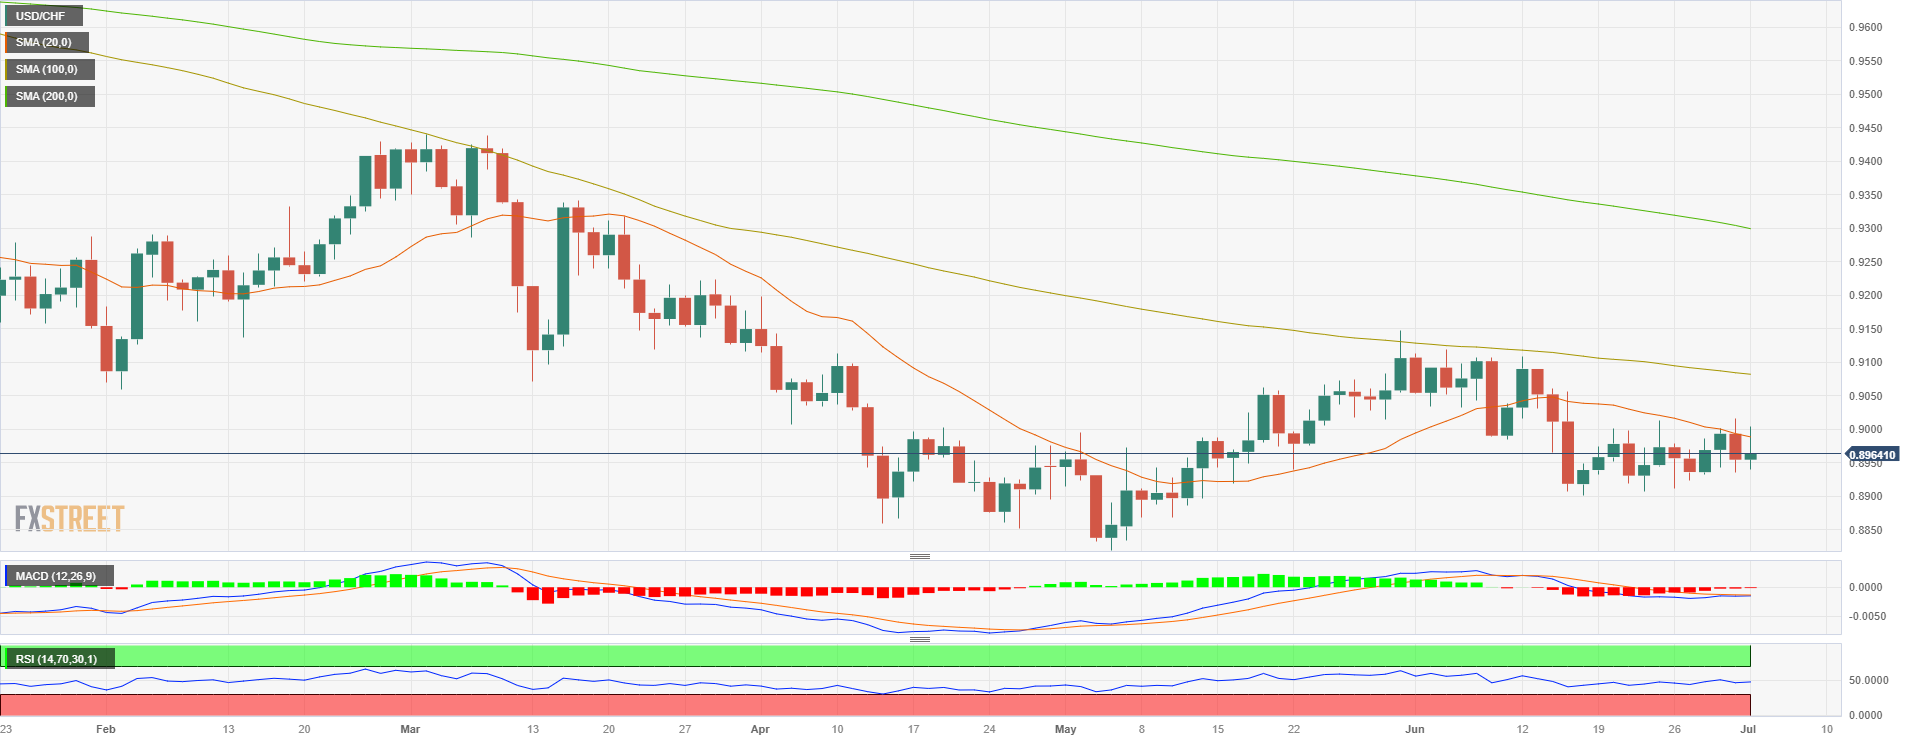
According to the daily chart, the technical outlook still favours the CHF despite daily losses. The Relative Strength Index (RSI) and the Moving Average Convergence Divergence (MACD) still hold in negative territory. In addition, the pair trades below the 20, 100 and 200-day Simple Moving Averages (SMA), suggesting that the sellers are in control.

Resistance Levels to watch: 0.8978 (20-day SMA), 0.9000, 0.9050.
Support Levels to watch: 0.8940, 0.8915,0.8900.

USD/CHF Daily chart

USD/CHF

Overview
Today last price0.8957
Today Daily Change0.0002
Today Daily Change %0.02
Today daily open0.8955
 
Trends
Daily SMA200.8994
Daily SMA500.8981
Daily SMA1000.9085
Daily SMA2000.9305
 
Levels
Previous Daily High0.9017
Previous Daily Low0.8936
Previous Weekly High0.9017
Previous Weekly Low0.8912
Previous Monthly High0.912
Previous Monthly Low0.8902
Daily Fibonacci 38.2%0.8967
Daily Fibonacci 61.8%0.8986
Daily Pivot Point S10.8921
Daily Pivot Point S20.8888
Daily Pivot Point S30.884
Daily Pivot Point R10.9003
Daily Pivot Point R20.9051
Daily Pivot Point R30.9084

Author

Patricio Martín

Patricio is an economist from Argentina passionate about global finance and understanding the daily movements of the markets.

More from Patricio Martín
Share:

Editor's Picks

GBP/USD bounces off lows, back above 1.3200

After bottoming out near 1.3160, GBP/USD manages to regain a bit of shine and reclaim the 1.3200 mark and beyond at the end of the week. Stronger-than-expected UK Retail Sales data seem to be helping the British Pound limit its losses, while the chaotic UK political environment keeps the bulls at bay for now.

EUR/USD looks consolidative around 1.1460

EUR/USD stages a modest rebound after slipping to a three-month low below 1.1420 at the end of the week. That said, the pair now looks to consolidate humble gains just above 1.1460 despite growing uncertainty surrounding the next round of US-Iran negotiations, which keeps the US Dollar’s downside contained.

Gold slips back to six-day lows, targets $4,100

Gold retreats for the third consecutive day on Friday, eroding gains seen in the first half of the week and approaching the key $4,100 mark per troy ounce. Indeed, the precious metal continues to face headwinds from the Fed's hawkish stance and renewed uncertainty surrounding the next round of US-Iran negotiations.

Breaking: Iran closes the Strait of Hormuz amid ceasefire deal violation
Iran says it is closing the Strait of Hormuz after accusing the United States (US) and Israel of violating the ceasefire. According to Iran, the decision came over the continued Israeli strikes in Lebanon. The Iranian Revolutionary Guard Corps Navy issued a warning to all vessels: "Do not approach the Strait of Hormuz; otherwise, your security will be jeopardized."
The Iran war didn't break the US economy, but what happens next?

Nearly four months after the start of the Iran war, the US economy remains remarkably resilient. While the conflict initially triggered a severe disruption to global energy markets and a sharp rise in Oil prices, recent diplomatic progress between Washington and Tehran has eased concerns about a prolonged supply shock.

Regime change: Inside Kevin Warsh's first move to make the Fed unreadable on purpose

The rate did not move. That was the least interesting thing about Kevin Warsh's first meeting in charge of the Fed. The FOMC held its benchmark at 3.50%-3.75% for the fourth straight meeting, exactly as priced, and then the new chair used his first press conference to dismantle the machinery the market has leaned on for a decade.