USD/CAD Technical Analysis: Weak below 50-DMA, 50% Fibonacci
- USD/CAD drops towards a familiar support zone.
- A week-long resistance line restricts immediate upside.
- Bearish MACD keeps sellers hopeful.

USD/CAD declines to 1.3168 by the press time of early Thursday. That said, the pair’s recently dropped below 50-Day Simple Moving Average (DMA) and 50% Fibonacci retracement of September-October fall.
Together with the fall below important confluence, bearish signals of 12-bar Moving Average Convergence and Divergence (MACD) also signal the return of 1.3160/55 area comprising multiple lows market since early November.
If prices slip beneath 1.3160, 23.6% Fibonacci retracement around 1.3120 and 1.3080 can entertain the Bears.
On the contrary, 1.3210/15 resistance confluence, including 50-DMA and 50% Fibonacci retracement, followed by a short-term falling trend line near 1.3230, can keep the quote’s U-turn in check.
Also, 61.8% Fibonacci retracement level of 1.3255 holds the key to pair’s rise towards November month high near 1.3330.
USD/CAD daily chart
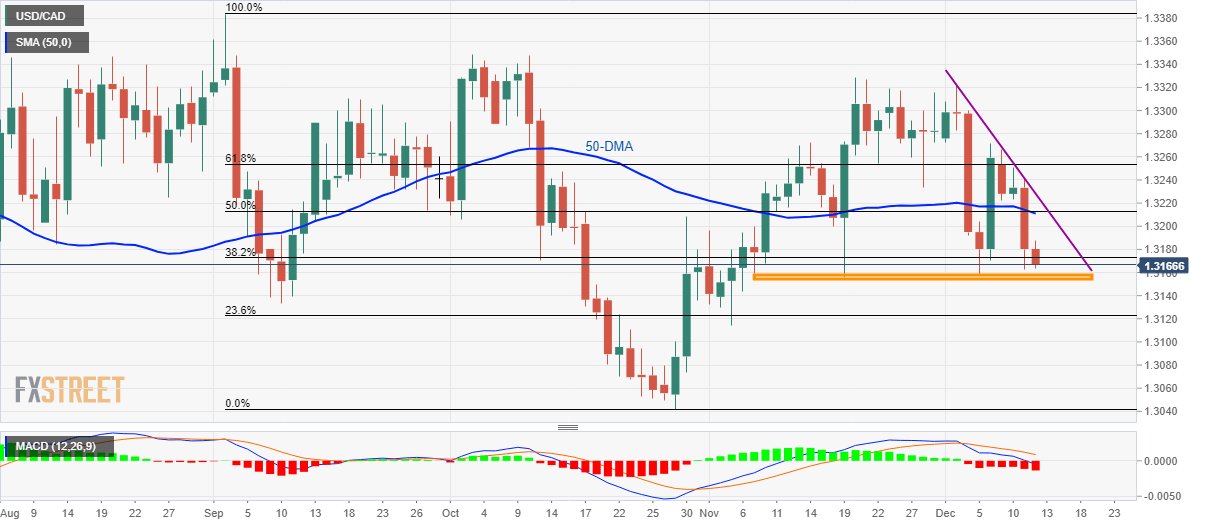
Trend: Bearish
Author

Anil Panchal
FXStreet
Anil Panchal has nearly 15 years of experience in tracking financial markets. With a keen interest in macroeconomics, Anil aptly tracks global news/updates and stays well-informed about the global financial moves and their implications.


