USD/CAD Technical Analysis: Greenback pushes beyond June’s highs against Loonie - 1.3340 bear target

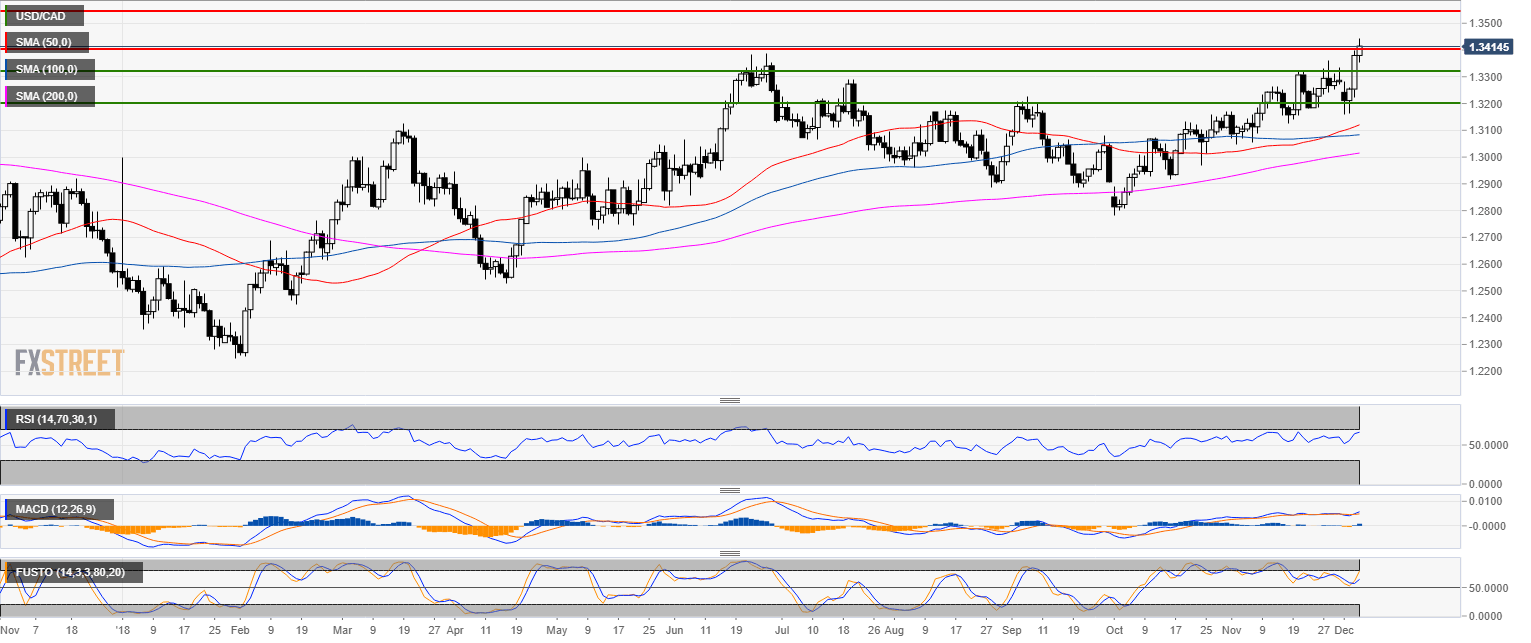
USD/CAD daily chart
- USD/CAD is trading in a bull trend above the 200-day simple moving average (SMA).
- Bulls are breaking above the June’s high.
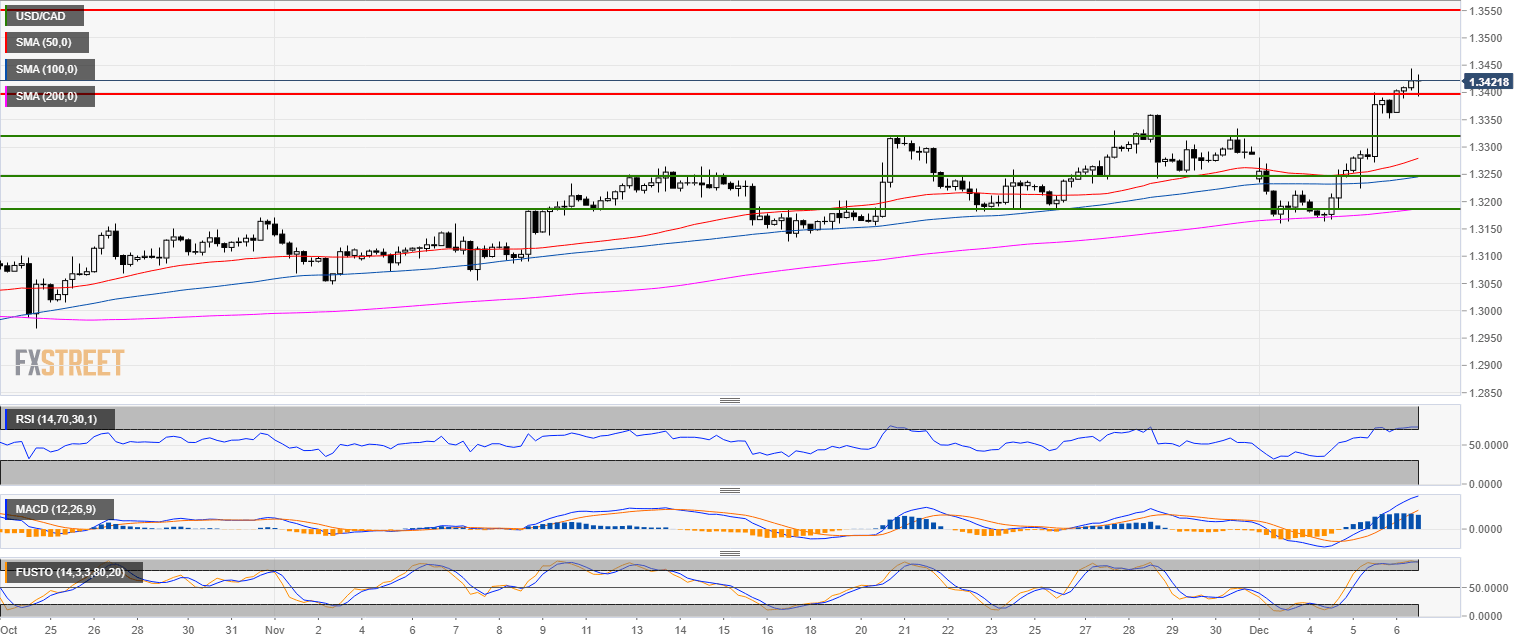
USD/CAD 4-hour chart
- Bulls should close above 1.3400 figure on a daily closing basis in order to claim higher prices.
- Targets to the upside can be seen near the 1.3500 and 1.3542 level for the coming weeks.
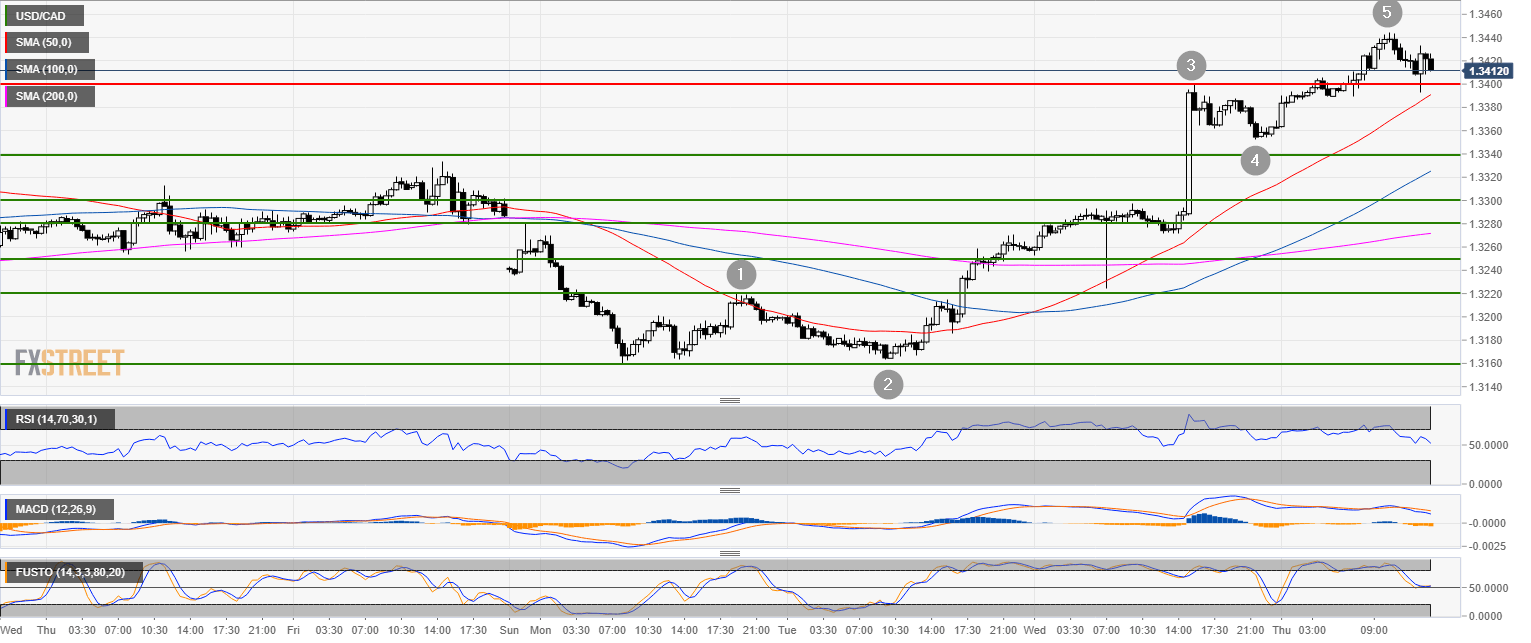
USD/CAD 30-minute chart
- USD/CAD is trading above its main SMAs.
- USD/CAD completed a 5-wave pattern suggesting a correction to 1.3340 level
Additional key levels
USD/CAD
Overview:
Today Last Price: 1.3422
Today Daily change: 42 pips
Today Daily change %: 0.314%
Today Daily Open: 1.338
Trends:
Previous Daily SMA20: 1.324
Previous Daily SMA50: 1.3113
Previous Daily SMA100: 1.3082
Previous Daily SMA200: 1.3009
Levels:
Previous Daily High: 1.34
Previous Daily Low: 1.3224
Previous Weekly High: 1.336
Previous Weekly Low: 1.3187
Previous Monthly High: 1.336
Previous Monthly Low: 1.3048
Previous Daily Fibonacci 38.2%: 1.3333
Previous Daily Fibonacci 61.8%: 1.3291
Previous Daily Pivot Point S1: 1.3269
Previous Daily Pivot Point S2: 1.3159
Previous Daily Pivot Point S3: 1.3093
Previous Daily Pivot Point R1: 1.3445
Previous Daily Pivot Point R2: 1.351
Previous Daily Pivot Point R3: 1.3621
Author

Flavio Tosti
Independent Analyst


