|

USD/CAD technical analysis: Greenback gaining some traction above 1.3300

  • USD/CAD is trading above 1.3300 support.
  • The level to beat for bulls is 1.3360. 
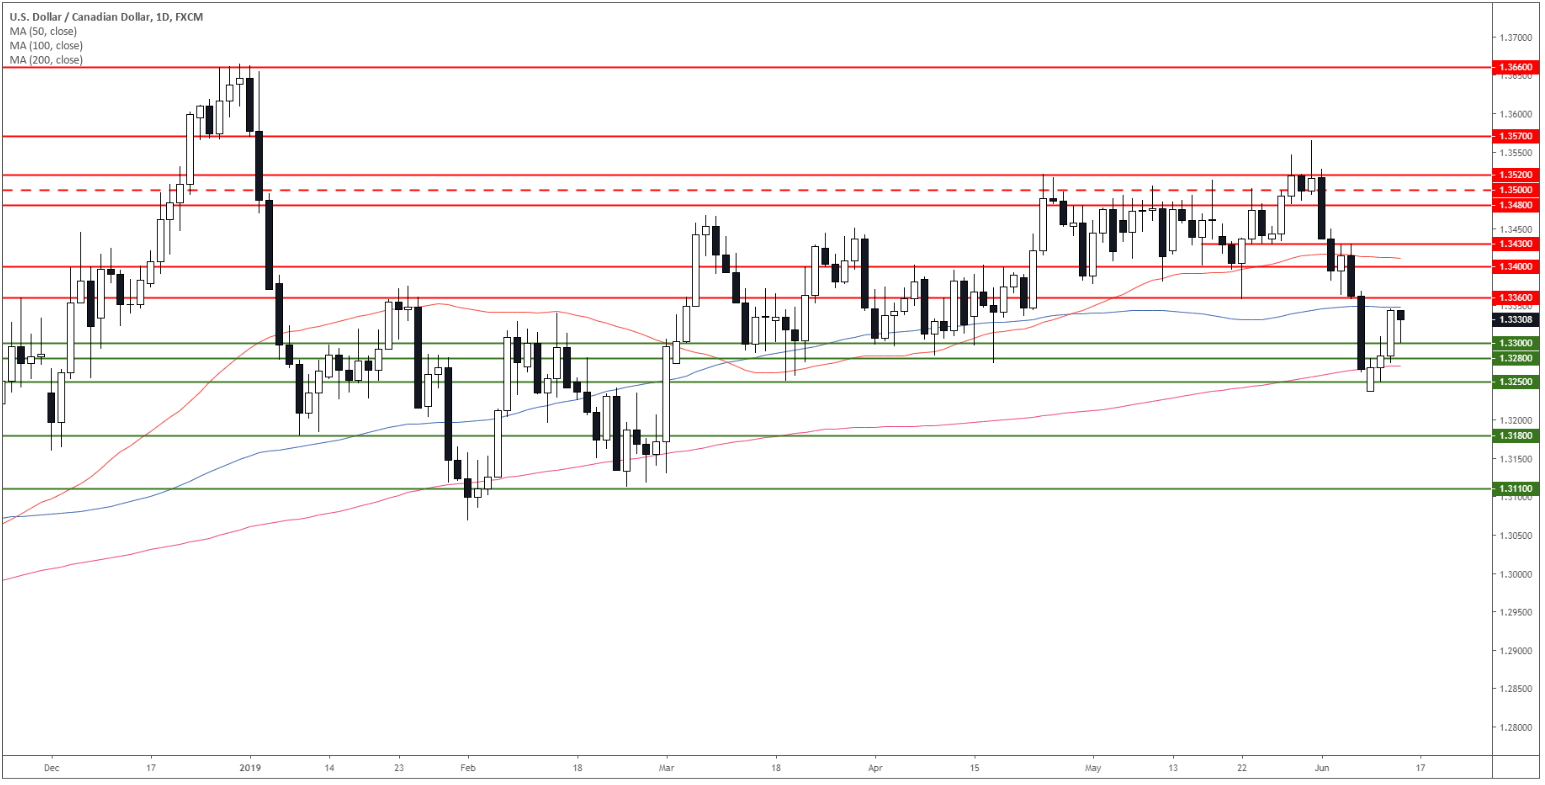
USD/CAD daily chart

The market is trading in a bull trend above its 200-day simple moving average (DSMA).

USD/CAD 4-hour chart

USD/CAD trades below its main SMAs. 

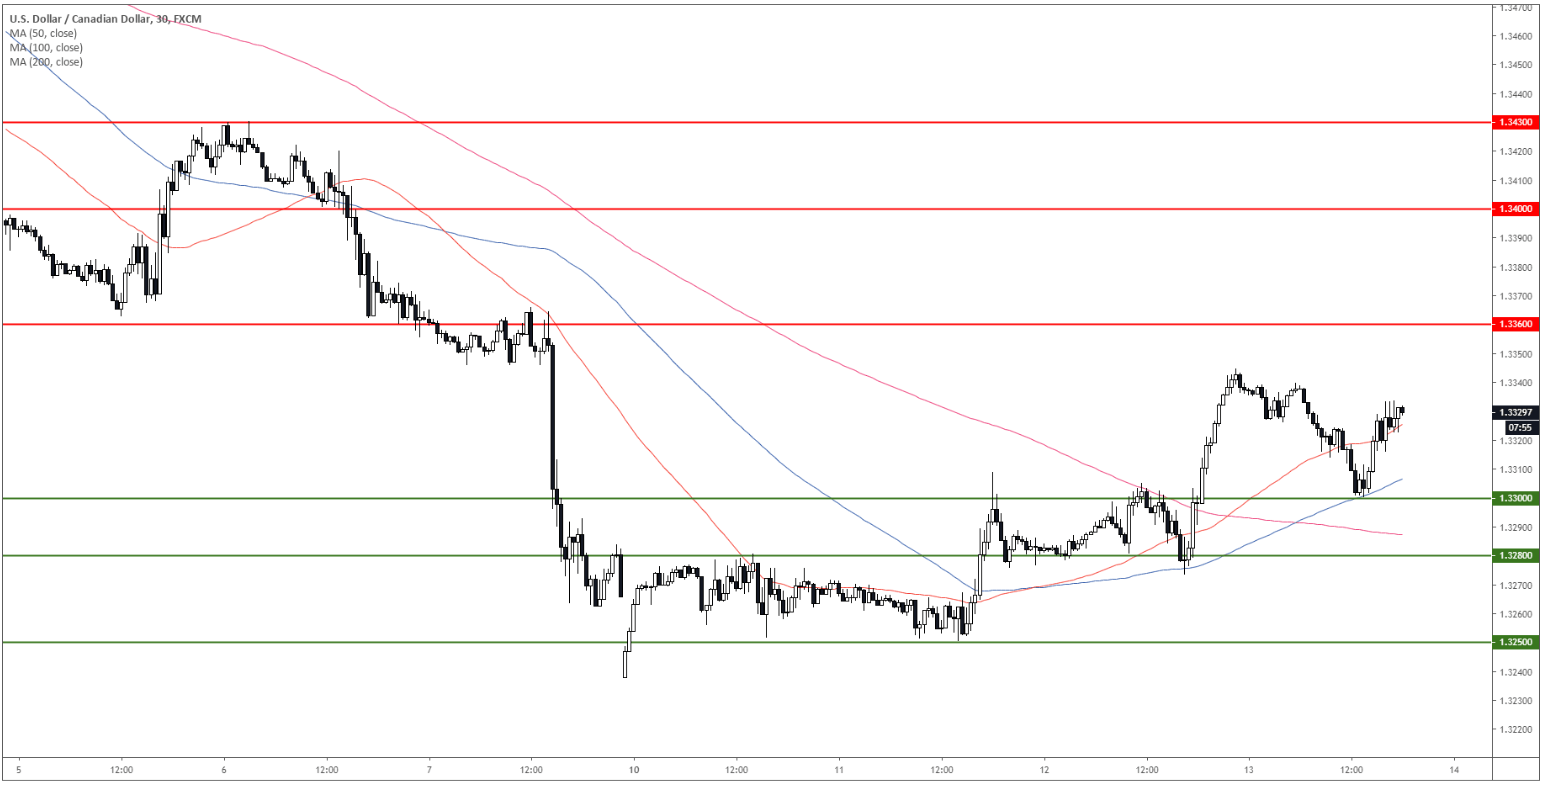
USD/CAD 30-minute chart

The currency pair is trading above 1.3300 support and its main SMAs. A break above 1.3360 can lead to 1.3400 and 1.3430. Support is at 1.3300 and 1.3280. 


Additional key levels

USD/CAD

Overview
Today last price1.3331
Today Daily Change-0.0013
Today Daily Change %-0.10
Today daily open1.3344
 
Trends
Daily SMA201.3417
Daily SMA501.3413
Daily SMA1001.3348
Daily SMA2001.3279
Levels
Previous Daily High1.3346
Previous Daily Low1.3274
Previous Weekly High1.3529
Previous Weekly Low1.3262
Previous Monthly High1.3566
Previous Monthly Low1.3357
Daily Fibonacci 38.2%1.3318
Daily Fibonacci 61.8%1.3301
Daily Pivot Point S11.3296
Daily Pivot Point S21.3249
Daily Pivot Point S31.3224
Daily Pivot Point R11.3368
Daily Pivot Point R21.3393
Daily Pivot Point R31.344

Author

Flavio Tosti

Flavio Tosti

Independent Analyst


More from Flavio Tosti
Share:

Editor's Picks

EUR/USD tests nine-day EMA support near 1.1850

EUR/USD remains in the negative territory for the fourth successive session, trading around 1.1870 during the Asian hours on Friday. The 14-day Relative Strength Index momentum indicator at 56 stays above the midline, confirming steady momentum. RSI has eased but remains above 50, indicating momentum remains constructive for the bulls.

GBP/USD consolidates around 1.3600 vs. USD; looks to US CPI for fresh impetus

The GBP/USD pair remains on the defensive through the Asian session on Friday, though it lacks bearish conviction and holds above the 1.3600 mark as traders await the release of the US consumer inflation figures before placing directional bets.

Gold recovers swiftly from weekly low, climbs back closer to $5,000 ahead of US CPI

Gold regains positive traction during the Asian session on Friday and recovers a part of the previous day's heavy losses to the $4,878-4,877 region, or the weekly low. The commodity has now moved back closer to the $5,000 psychological mark as traders keenly await the release of the US consumer inflation figures for more cues about the Federal Reserve's policy path.

Solana: Mixed market sentiment caps recovery

Solana is trading at $79 as of Friday, following a correction of over 9% so far this week. On-chain and derivatives data indicates mixed sentiment among traders, further limiting the chances of a price recovery.

A tale of two labour markets: Headline strength masks underlying weakness

Undoubtedly, yesterday’s delayed US January jobs report delivered a strong headline – one that surpassed most estimates. However, optimism quickly faded amid sobering benchmark revisions.

Solana Price Forecast: Mixed market sentiment caps recovery

Solana (SOL) is trading at $79 as of Friday, following a correction of over 9% so far this week. On-chain and derivatives data indicates mixed sentiment among traders, further limiting the chances of a price recovery.