USD/CAD technical analysis: Buyers again target 3-week old resistance-line
- Sustained momentum strength indicates the pair’s ability to confront near-term important resistance.
- The further upside seems doubtful considering RSI and repeated failures to cross resistance-line.

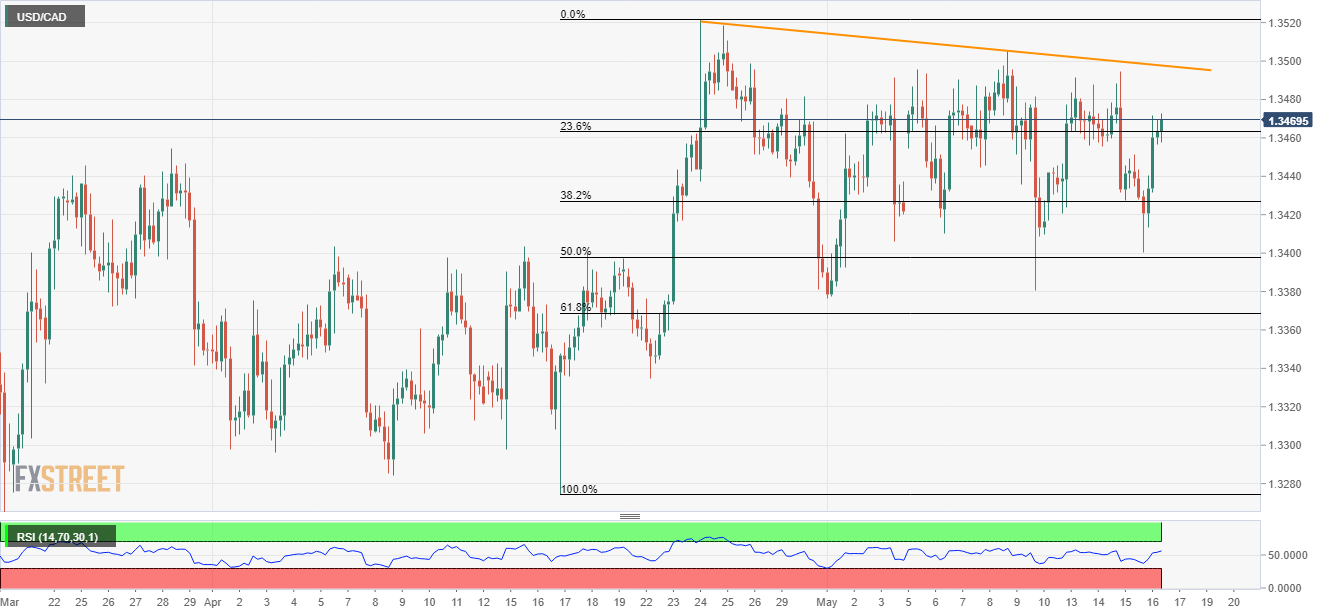
Having bounced off the 50% Fibonacci retracement of April month upside, USD/CAD is on the bids around 1.3475 ahead of Europe open on Friday.
A descending trend-line stretched since late-April at 1.3500 seems to be of immediate interest to buyers, a break of which can propel the rise towards April high near 1.3525.
However, gradually increasing 14-bar relative strength index (RSI) might create a problem for the quote’s increase beyond 1.3525, if not then an upward sloping line joining the high of January 07 to March tops can question optimists near 1.3560.
Meanwhile, 50% Fibonacci retracement level near 1.3400 acts as immediate support ahead of highlighting 1.3365/70 support-zone comprising 61.8% Fibonacci retracement.
In a case where prices keep trading south after 1.3365, 1.3300 and 1.3275 support levels could become bears’ favorites.
USD/CAD 4-Hour chart
Trend: Positive
Author

Anil Panchal
FXStreet
Anil Panchal has nearly 15 years of experience in tracking financial markets. With a keen interest in macroeconomics, Anil aptly tracks global news/updates and stays well-informed about the global financial moves and their implications.


