• USD/CAD slump for the first time in three days after posting losses of almost 1.70%.
  • USD/CAD fell amid US dollar weakness across the board.
  • USD/CAD: The 1-hour chart depicts a triple top chart pattern, with a target of 1.2530.

USD/CAD struggles to gain traction above 1.2600, is falling 0.31%, trading at 1.2549 during the New York session at the time of writing. The Canadian dollar has been under selling pressure, as witnessed by the price action in the last three days, down almost 1.70%. Nevertheless, on Friday, the Loonie has recovered some ground, mainly driven by USD profit-taking.

DXY falls as the weekend approaches but holds to the 95 figure

Meanwhile, the greenback is falling against most G8 currencies. The US Dollar Index measurement of the buck against six currencies slides 0.02%, sitting at 95.12. Contrarily, US T-bond yields rise, with the 10-year benchmark note rising two basis points, currently at 1.58%. 

USD/CAD direction would lie in the hands of the Bank of Canada (BoC) and US dollar dynamics. However, on Wednesday, US inflation rose to a 30-year high above 6%, which spurred an upside move in US Treasuries and the US dollar.

On the macroeconomic front, the US economic docket featured the University of Michigan Consumer Sentiment Index for November edged lower to 66.8, lower than the 71.7 in October, marking the lowest reading since November 2011.

USD/CAD Price Forecast: Technical outlook

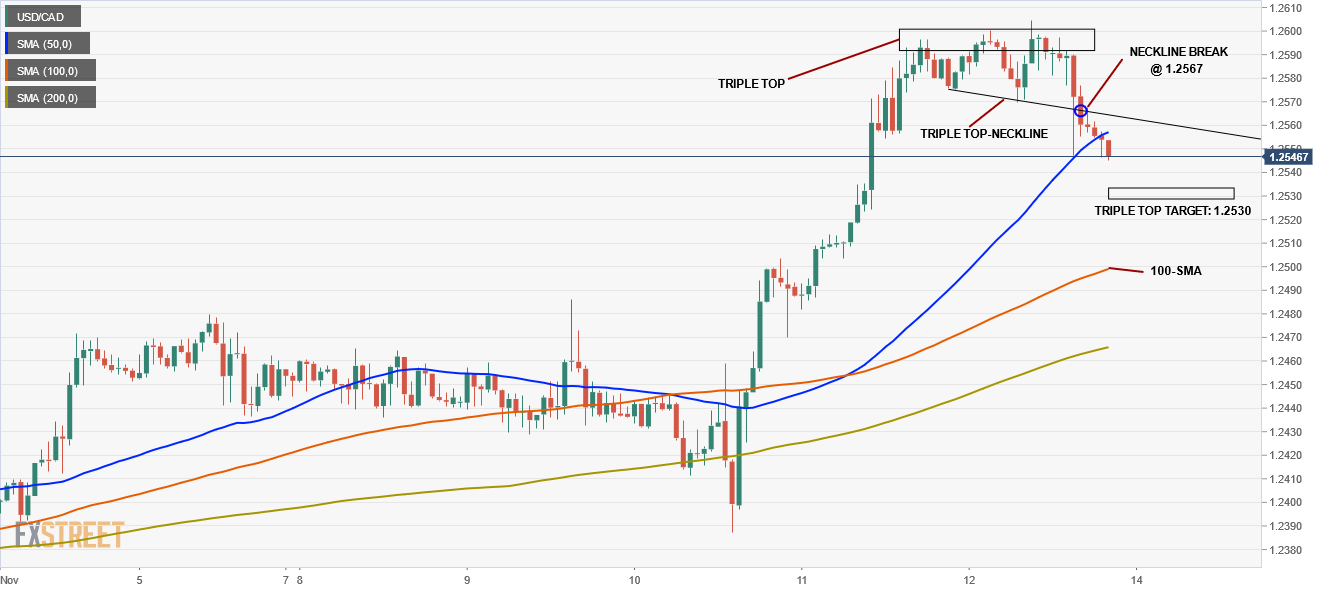
The  1-hour chart depicts a technical move that spurred the recovery of the Loonie. A triple-top chart pattern formed around the 1.2570-1.2600 range. The price broke below the neckline around 1.2567, which would act as resistance in case of an upward swing. Further, the USD/CAD price is under the 50-simple moving average (SMA), exerting additional selling pressure on the pair. The triple-top target is  1.2530, an area that confluences with the 50-day moving average (DMA).

A break below the triple’s top target would expose the 100-SMA around the 1.2500 figure.

USD/CAD

Overview
Today last price 1.2546
Today Daily Change -0.0042
Today Daily Change % -0.33
Today daily open 1.2588
 
Trends
Daily SMA20 1.2404
Daily SMA50 1.2538
Daily SMA100 1.2541
Daily SMA200 1.2475
 
Levels
Previous Daily High 1.2596
Previous Daily Low 1.247
Previous Weekly High 1.248
Previous Weekly Low 1.2352
Previous Monthly High 1.2739
Previous Monthly Low 1.2288
Daily Fibonacci 38.2% 1.2548
Daily Fibonacci 61.8% 1.2518
Daily Pivot Point S1 1.2506
Daily Pivot Point S2 1.2425
Daily Pivot Point S3 1.238
Daily Pivot Point R1 1.2633
Daily Pivot Point R2 1.2678
Daily Pivot Point R3 1.276


Share: Feed news

Information on these pages contains forward-looking statements that involve risks and uncertainties. Markets and instruments profiled on this page are for informational purposes only and should not in any way come across as a recommendation to buy or sell in these assets. You should do your own thorough research before making any investment decisions. FXStreet does not in any way guarantee that this information is free from mistakes, errors, or material misstatements. It also does not guarantee that this information is of a timely nature. Investing in Open Markets involves a great deal of risk, including the loss of all or a portion of your investment, as well as emotional distress. All risks, losses and costs associated with investing, including total loss of principal, are your responsibility. The views and opinions expressed in this article are those of the authors and do not necessarily reflect the official policy or position of FXStreet nor its advertisers. The author will not be held responsible for information that is found at the end of links posted on this page.

If not otherwise explicitly mentioned in the body of the article, at the time of writing, the author has no position in any stock mentioned in this article and no business relationship with any company mentioned. The author has not received compensation for writing this article, other than from FXStreet.

FXStreet and the author do not provide personalized recommendations. The author makes no representations as to the accuracy, completeness, or suitability of this information. FXStreet and the author will not be liable for any errors, omissions or any losses, injuries or damages arising from this information and its display or use. Errors and omissions excepted.

The author and FXStreet are not registered investment advisors and nothing in this article is intended to be investment advice.

Recommended content


Recommended content

Editors’ Picks

EUR/USD clings to daily gains above 1.0650

EUR/USD clings to daily gains above 1.0650

EUR/USD gained traction and turned positive on the day above 1.0650. The improvement seen in risk mood following the earlier flight to safety weighs on the US Dollar ahead of the weekend and helps the pair push higher.

EUR/USD News

GBP/USD recovers toward 1.2450 after UK Retail Sales data

GBP/USD recovers toward 1.2450 after UK Retail Sales data

GBP/USD reversed its direction and advanced to the 1.2450 area after touching a fresh multi-month low below 1.2400 in the Asian session. The positive shift seen in risk mood on easing fears over a deepening Iran-Israel conflict supports the pair.

GBP/USD News

Gold holds steady at around $2,380 following earlier spike

Gold holds steady at around $2,380 following earlier spike

Gold stabilized near $2,380 after spiking above $2,400 with the immediate reaction to reports of Israel striking Iran. Meanwhile, the pullback seen in the US Treasury bond yields helps XAU/USD hold its ground.

Gold News

Bitcoin Weekly Forecast: BTC post-halving rally could be partially priced in Premium

Bitcoin Weekly Forecast: BTC post-halving rally could be partially priced in

Bitcoin price shows no signs of directional bias while it holds above  $60,000. The fourth BTC halving is partially priced in, according to Deutsche Bank’s research. 

Read more

Geopolitics once again take centre stage, as UK Retail Sales wither

Geopolitics once again take centre stage, as UK Retail Sales wither

Nearly a week to the day when Iran sent drones and missiles into Israel, Israel has retaliated and sent a missile into Iran. The initial reports caused a large uptick in the oil price.

Read more

Forex MAJORS

Cryptocurrencies

Signatures