USD/CAD Price Forecast: Tests nine-day EMA barrier near 1.3700
- USD/CAD may find the primary support at nine-month low of 1.3539.
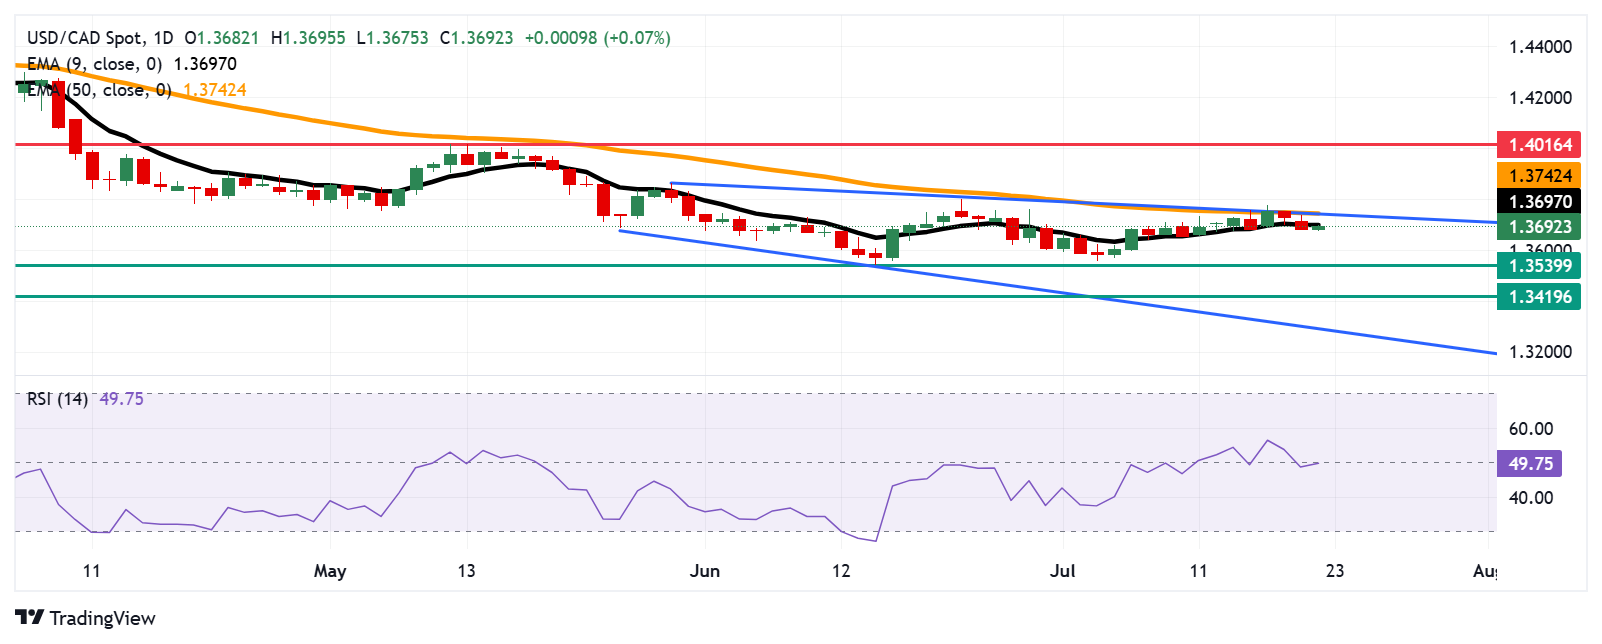
- The market bias is bearish as the 14-day RSI is positioned below the 50 level.
- The immediate resistance appears at the nine-day EMA of 1.3697.

USD/CAD gains ground after two days of losses, trading around 1.3690 during the early European hours on Monday. However, the bearish bias persists as the daily chart’s technical analysis indicates that the pair moves sideways within the descending channel pattern.
The 14-day Relative Strength Index (RSI) is positioned below the 50 level, suggesting the strengthening of a bearish bias. Additionally, the USD/CAD pair has moved below the nine-day Exponential Moving Average (EMA), suggesting the short-term price momentum is weaker.
On the downside, the USD/CAD pair may target the primary support at nine-month low of 1.3539. A successful break below this level could reinforce the bearish bias and prompt the pair to navigate the region around 1.3419, the lowest since February 2024, followed by the lower boundary of the descending channel around the psychological level of 1.3300.
The USD/CAD pair is testing the immediate barrier at the nine-day EMA of 1.3697, followed by the 50-day EMA at 1.3742, aligned with the descending channel’s upper boundary. A break above this crucial resistance zone would improve the short- and medium-term price momentum and support the pair to explore the region around the three-month high of 1.4016, which was reached on May 13.
GBP/USD: Daily Chart
Canadian Dollar PRICE Today
The table below shows the percentage change of Canadian Dollar (CAD) against listed major currencies today. Canadian Dollar was the weakest against the US Dollar.
| USD | EUR | GBP | JPY | CAD | AUD | NZD | CHF | |
|---|---|---|---|---|---|---|---|---|
| USD | 0.06% | 0.17% | 0.35% | 0.08% | 0.22% | 0.40% | 0.09% | |
| EUR | -0.06% | 0.14% | 0.31% | 0.03% | 0.16% | 0.42% | 0.05% | |
| GBP | -0.17% | -0.14% | 0.18% | -0.10% | 0.02% | 0.22% | -0.09% | |
| JPY | -0.35% | -0.31% | -0.18% | -0.26% | -0.15% | 0.11% | -0.33% | |
| CAD | -0.08% | -0.03% | 0.10% | 0.26% | 0.12% | 0.35% | 0.02% | |
| AUD | -0.22% | -0.16% | -0.02% | 0.15% | -0.12% | 0.22% | -0.15% | |
| NZD | -0.40% | -0.42% | -0.22% | -0.11% | -0.35% | -0.22% | -0.37% | |
| CHF | -0.09% | -0.05% | 0.09% | 0.33% | -0.02% | 0.15% | 0.37% |
The heat map shows percentage changes of major currencies against each other. The base currency is picked from the left column, while the quote currency is picked from the top row. For example, if you pick the Canadian Dollar from the left column and move along the horizontal line to the US Dollar, the percentage change displayed in the box will represent CAD (base)/USD (quote).
Author

Akhtar Faruqui
FXStreet
Akhtar Faruqui is a Forex Analyst based in New Delhi, India. With a keen eye for market trends and a passion for dissecting complex financial dynamics, he is dedicated to delivering accurate and insightful Forex news and analysis.


